Welcome back to another Data Stories installment! This week our very own Diversity Dashboard data coordinator, Chuck Lehmuller has a Dashboard update for us!
Diversity Dashboard Response Patterns
What We Know
As you all know, we started collecting data for our expansive, ground-breaking Diversity Dashboard project back in March. We’ve been closely analyzing these data for patterns that we think might be interesting for you! While the previous posts have focused on the stories told by the various categories of responses, we felt that another story was told by the data collection and the sources of data that we’d like to share with you.
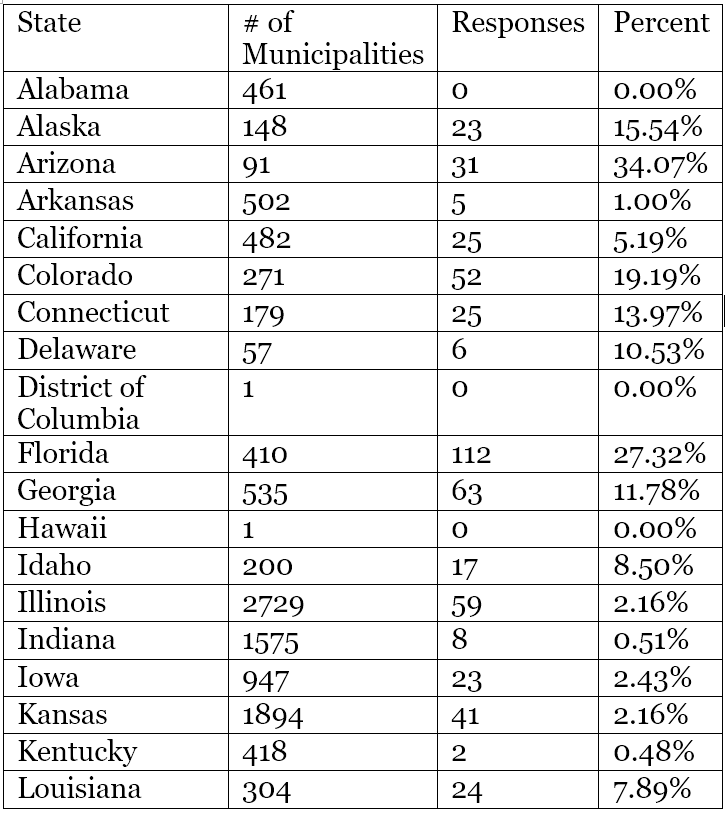
Data collection went really well over the spring and summer, with the most responses coming in back in March. To us, this shows how excited everyone was when our project launched, and the continued interest through the summer shows how happy governments were to contribute! So far, as of the end of the summer, we’ve received 1,796 unique responses, which equals about five percent of all sub-county local governments in the United States. This is great, but we still have a lot of work to do. We’re planning on another push for responses, so stay tuned. Later, we’ll be going over what you can do to help us grow this number!

Most of our responses come from smaller cities and towns with populations of less than 10,000. This is not surprising, as governments of these sizes comprise the vast majority of sub-county governments in the United States. In fact, we are slightly over-represented on larger cities and towns! This means that out of the population of the United States, respondents represent over 10 percent of the country’s population. This isn’t to say that our sample isn’t representative; by and large, the makeup of our sample fairly closely matches that of the United States.

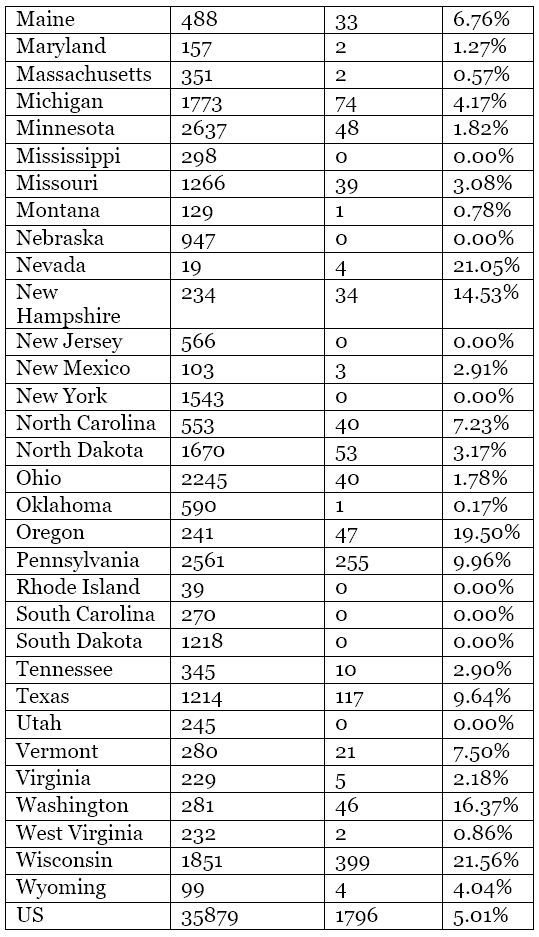
Some states have been great with responding! We’d like to shout out to our friends in Wisconsin, Pennsylvania, Texas, and Florida for providing the most responses to our survey. Keep up the good work! We don’t want to forget about everyone else though, because all of your contributions are so meaningful to us.
Some states have been great with responding! We’d like to shout out to our friends in Wisconsin, Pennsylvania, Texas, and Florida for providing the most responses to our survey. Keep up the good work! We don’t want to forget about everyone else though, because all of your contributions are so meaningful to us.
You may notice that some states haven’t responded to our survey. This is because we haven’t received contact information for the local governments in those states. For those of you in those states: please feel free to go to https://elgl.org/diversity-dashboard/ and take the survey! We would love your contributions.
Keep following us for more on how you can contribute to the project. You can help us with our groundbreaking project just by taking the survey or passing along the survey link to those in your contact list. Stay tuned!