This is the fourth installment in a multi-part blog series by Sam Edelstein about the role of a Chief Data Officer.
- Read part one about the job, here.
- Read part two about counting, here.
- Read part three about trends, here.
First we count things correctly, then we use those counts to see if we have done more work today than yesterday and start to understand trends. The next layer of complexity is to start using those trends to predict what might happen tomorrow.
If we can predict, then we can proactively do work to avoid problems rather than looking backwards to understand if the work we did was effective. It is particularly important when working to predict things that you understand the historic data that is informing your model.
Hopefully you are counting everything and your trends are accurately reflecting the work that has been done.
But, sometimes work gets done in a biased manner. We fill potholes based on complaints, so if a particular neighborhood doesn’t complain much about potholes, even though the potholes exist in that neighborhood, if we then attempt to build a predictive model about where potholes will turn up, we won’t have data on pothole locations in that neighborhood, and thus the model may not direct us to fill potholes there.
The result is that the model uses historic information and the bias that is built into that information to make predictions about what will happen in the future. In this case, the neighborhood will not have had potholes filled before, and will continue to not have them filled.
The municipality may not know that there is a problem, but people will be given inequitable service. Identifying those biases and solving for them must happen before the project begins.

Water Main Risk
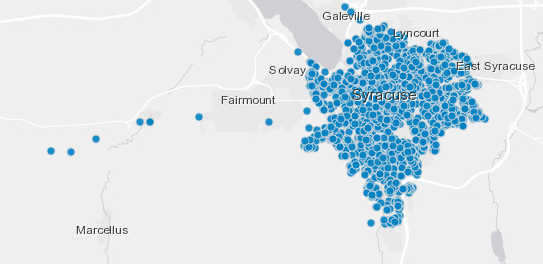
In Syracuse, we are an older northeastern city that has infrastructure, like water mains, that are mostly past their useful life — some mains are more than 100 years old.
Due to a combination of factors, the water mains break regularly — hundreds of times per year. This leaves people on the block where the water main broke without water for hours. It also causes Water Department crews to be reactive in their work rather than proactive.
The Water Department workforce is also older — many expected to retire in the next five years. They have a large amount of institutional knowledge, but it is mostly passed down through stories rather than writing down important issues to know about.
Water mains are also not the only piece of infrastructure that fails regularly in Syracuse. I wrote about roads in poor condition and the sewers also collapse and back up too often.
When the opportunity to replace a sewer or repave a road comes up, it is important to know how risky the water main is so that the main does not break soon after a road is repaved — causing crews to dig into a brand new road. This happens all too often due to lack of information and coordination.
As a potential solution to these issues, we embarked on a project to predict the risk of water mains breaking throughout the city, working with a team from the Data Science for Social Good program at the University of Chicago.
Though staff might be able to identify the most risky mains, ensuring their knowledge was documented was important since many of them would retire. Additionally, while staff might have a sense on risk, it is difficult to think about risk over 400+ miles of water main.
Also, different staff made different assumptions about why and where mains break. Doing an analysis that brought some level of objectivity to the process, and also was able to visualize the risk on a map could be useful.
To do the project, first we needed to count correctly. Just defining how many water main breaks occurred was not as straight-forward as we had hoped. First, fortunately, we had data about breaks.
The GIS Analyst in the Water Department had digitized most of the water system, including all of the work that had been done in the last decade. This meant we knew locations of water mains, some ages and materials of the mains, and which had breaks since about 2008.
The number of confirmed breaks, though, was different than the number of breaks that were called in. Many times, the dispatchers generated a work order for a water main break based on the report they received, but the work turned out to be some other issue.
As we got into building the dataset to be used for modeling, we realized we needed more information about the material of the water mains. Since this was not digitized, the team looked at the original engineering books from a century ago and did some data entry.
Yes, sometimes building predictive models involves data entry from 100 year old books.
Once the data was in a good enough place, we could look at trends like the time of year breaks happened most, which mains tended to break most, and which parts of the city breaks happened most commonly.
From there, we were able to also join other data about soil, road ratings, the last year a road was paved (some thought that the act of paving the road could hurt the water main — this turned out not to be true), and more.
The team used a gradient boosting model to assign risk scores to each section of water main in the city. The model choice came at the end, following testing of a number of other models and after much data entry and cleaning.
The expectation was that the model would predict 32 of the top 50 most risky mains would break over the next three years. During that time, we used the model to help dictate where construction should and should not happen.
We were also able to work with developers in the city that were doing major projects that involved digging up the road.
The City took advantage of the road being opened to install new water mains, saving more than $1 million in the process.
Unfortunately there was not enough money to replace all of the most risk mains, but in the three years since the model was developed, 32 of those top 50 risky water mains did break, many of them more than once, proving the effectiveness of the model and meeting many of the objectives we set at the beginning of the project.
Supplemental Reading
Podcast: Innovation Doesn’t Have to be Fancy with Sam Edelstein & Brendan Babb