This post is by ELGL member Andrew Hening, the Director of Homeless Planning & Research for the City of San Rafael, CA.
Despite growing up in Richmond, Virginia, the former capital of the Confederacy, it took living in the San Francisco Bay Area to understand the deep-seated, systemic nature of racism in America’s housing system.
Housing isn’t the sexiest realm of public policy, but it is the cornerstone of countless other systems affecting our lives — where our kids go to school, the jobs around us, where policing takes place, wealth appreciation.
Racist government policies corrupted America’s housing system until the late 1960s, and 50 years later, communities across the country are still dealing with the consequences.
The Explosive Growth of America’s Suburbs
As World War II started drawing to a close, President Harry Truman began calling for a “Fair Deal”, which included “a decent home in a decent environment for every American.”
This vision — this goal — was the driving force behind our modern housing system, and suburbia became the vehicle to achieve it.
In the years immediately following World War II, less than 25% of Americans lived in the suburbs. Today, over 50% of Americans live in the suburbs. This explosive growth was not an accident.
To unleash suburbia’s full potential, suburban homes had to be cheap, and they had to be easy to get to. To start to make this a reality, governments reached to three tools that had been developed during the Great Depression:
- Federal mortgage insurance & assistance
- Publicly-funded infrastructure projects
- Slum clearance
As famed suburban housing developer William Levitt testified before Congress in 1957, “We are 100 percent dependent on Government”
Mortgage Insurance & Assistance
A mortgage is just another word for a loan. When banks give loans, they want to make sure that the borrower has the ability to repay the money that is being lent.
Mortgage insurance is amazing for a lender because it means that if the borrower cannot repay the loan, some other entity (e.g. the government) promises to cover the remaining balance.
Federal mortgage insurance first appeared during the Great Depression as a way to prop up the construction industry. If consumers and banks were worried about building homes, insurance could instill more confidence.

Flash forward to the closing years of World War II, and Congress passed the Servicemen’s Readjustment Act of 1944, also known as the G.I. Bill, which provided a range of benefits to returning Veterans, including mortgage assistance and insurance.
My grandfathers, who were both white, fought in WWII and had access to the G.I. Bill when they came home. African American Veterans who fought alongside them, who took the same risks and exhibited the same courage, were explicitly denied access to these benefits.
Being excluded from compensation for the exact same contribution is bad enough, but government insurance policy made the situation even worse.
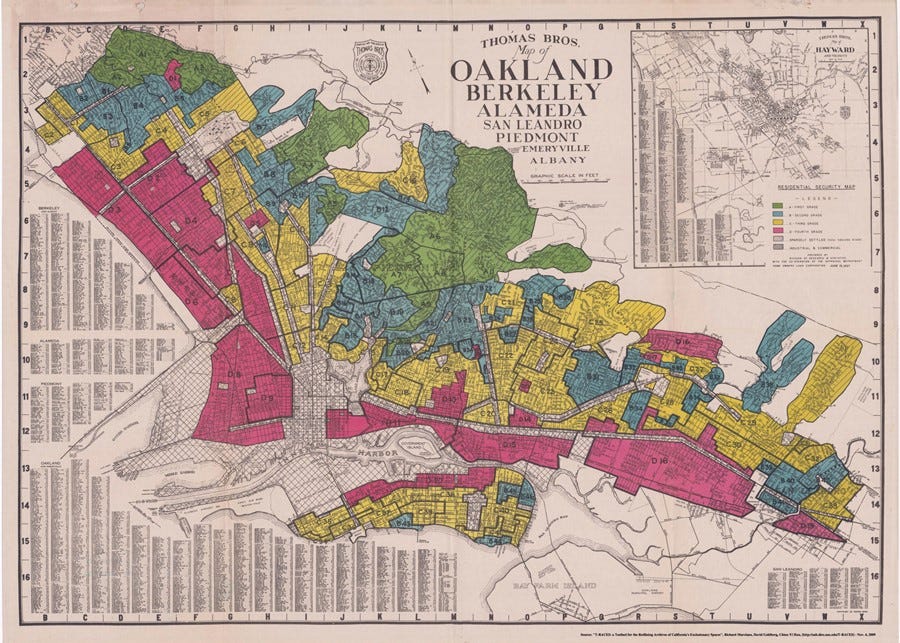
To assess mortgage insurance “risk”, the Federal Housing Administration created “residential security maps.” On these maps, desirable neighborhoods were outlined in green and known as “Type A”. They were typically affluent suburbs on the outskirts of cities and often had legally enforceable racial restrictions on who could live there. For example, in one of William Levitt’s developments, homeowners were forbidden to rent or sell to persons “other than members of the Caucasian race.”
On the other end of the spectrum, “Type D” neighborhoods were outlined in red and were considered the riskiest areas to cover. These neighborhoods tended to be the older districts in the center of cities, as well as more diverse communities generally. This red marking gives us the term “redlining.”
In his fantastic book The Color of Law, Richard Rothstein provides many examples of this process:
Stuyvesant Town, a 9,000-apartment complex built on Manhattan’s East Side in the 1940s by the Metropolitan Life Insurance Company. The process of construction began with the city condemning 18 square blocks of a racially integrated neighborhood and transferring the land to the company, which received tax relief as well. Met Life executives made it clear that Stuyvesant Town was for “white people only” — a policy that led to protests and a compromise whereby the company agreed to lease a handful of apartments to “qualified Negro tenants,” while building a “smaller development” for black renters in Harlem.
Again, redlining was bad enough on its own, but in many cases it actively reversed integration, creating segregated neighborhoods where they didn’t previously exist.
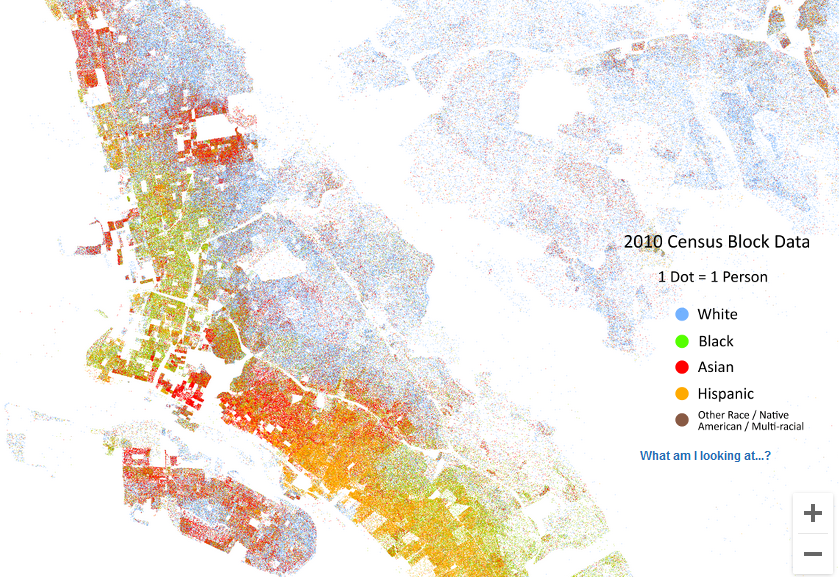
Redlining took place all over the country, not just in the South. Looking at redlining maps from Oakland / Berkeley, California, over 50 years later, residential demographics STILL mirror this original segregation.

Highways and Slum Clearance
In addition to being affordable, suburbs also had to be accessible. Unlike the dense, walkable neighborhoods of cities, suburbs required new modes of transportation — most specifically, the automobile.
As much as Americans love their cars, another less glamorous technology literally paved the way to wide-scale adoption of the individual motor vehicle — highways.
During World War II, General Dwight D. Eisenhower had been thoroughly impressed by the German autobahn highway system for its ability to quickly move military resources throughout the country.
As President, Eisenhower wanted to make sure the US was prepared for any possible invasion effort from the Soviet Union, and in 1955, he directed the Department of Defense (DOD) to create a testing facility in central Illinois to evaluate highway technologies like pavement types and construction techniques.
The following year Congress passed the Federal-Aid Highway Act, designating federal funds for the construction of an interstate highway system. When the last section of I-105 was completed in Los Angeles in 1993, the system had taken 37 years to build 42,795 miles of road at a cost of $425 billion.

Importantly, however, the highway system wasn’t just about roads and cars. Beginning during the Great Depression, urban planners (the people who help figure out what should be built where in a city) began to propose the idea of using highways to “redeem” urban areas. This “redemption” was often executed in racist ways.
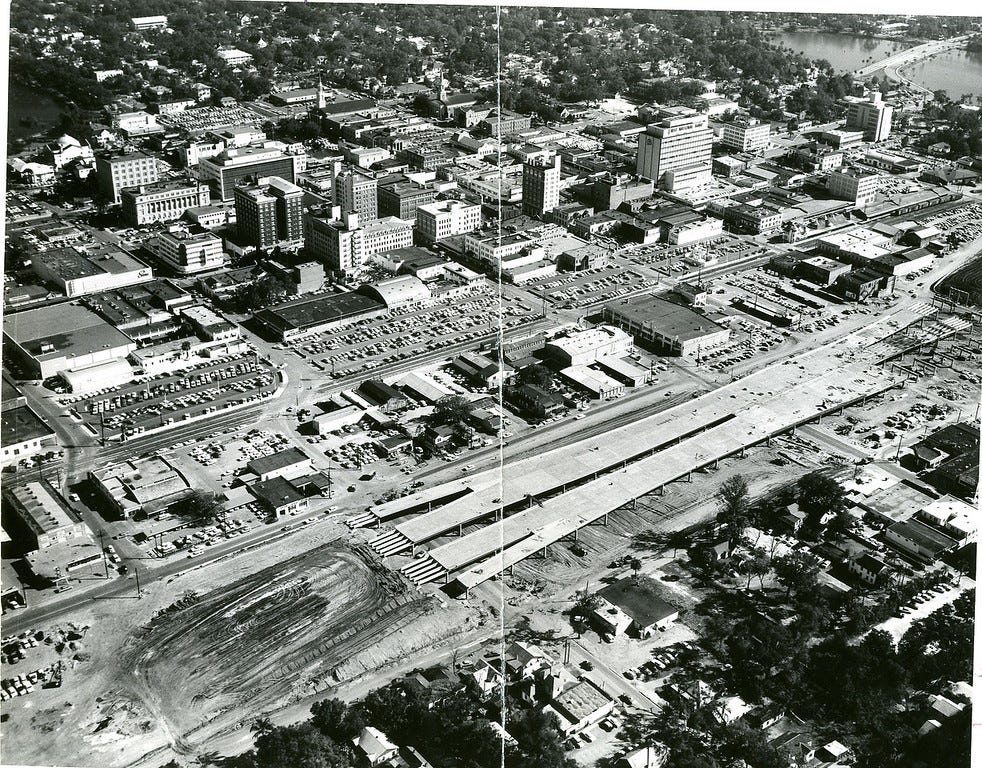
Take Syracuse, New York as an example. Back in the 1950s, there was an area in downtown near Syracuse University called the 15th Ward, which was a working class, African American neighborhood. The neighborhood was bulldozed and replaced with an elevated section of I-81.
As reported by The Atlantic, “[This process] decimated a close-knit African American community. And when the displaced residents from the 15th Ward moved to other city neighborhoods, the white residents fled. It was easy to move. There was a beautiful new highway that helped their escape.”
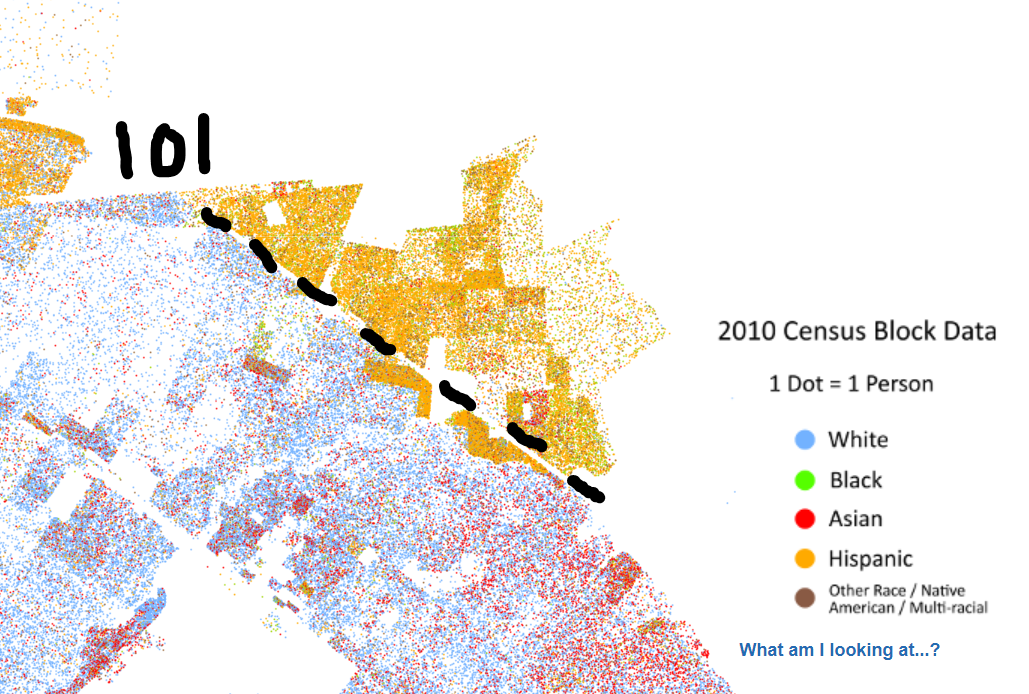
The impacts of these taxpayer-funded projects persist to this day. In Palo Alto, California, where many liberal tech billionaires reside, there is still a clear economic and racial demarcation between Palo Alto proper and East Palo Alto, the latter of which was created by the construction of highway 101.
Reevaluating My Own Family History
As I began to understand this history, I was forced to reevaluate my own upbringing, and as I did, I started to see how prejudice and policy came together to sustain inequalities and discrimination.
Not only did my grandfathers have access to a government benefit African Americans did not (policy), I remembered how my dad’s parents told me they moved out of the City of Richmond to Henrico County when the schools integrated (prejudice). Redlining then prevented African American families from also moving to the county (policy).

Over time, the neighborhood where my grandparents moved appreciated in value, which ultimately produced multi-generational wealth for our family and helped contribute to the cost of me going to college.
Today, “The median family wealth for white people is $171,000, compared with just $17,600 for black people. It is worse on the margins. According to the Economic Policy Institute, 19 percent of black households have zero or negative net worth. Just 9 percent of white families are that poor.” Housing is a big reason why.
However, it’s not just wealth. Again, housing is the cornerstone of many other systems.
I grew up not far from where my grandparents settled. That neighborhood determined my elementary school, middle school, and high school, all of which were some of the best in the state. That K-12 education, in turn, enabled me to go to one of the best universities in the entire country, which in the long-run has helped me increase my earning power and ultimately allowed me to purchase my own home.
Where I lived growing up also shaped my experience with the criminal justice system. In high school, I got cited for underage drinking. My punishment? Counseling. I assumed everyone got counseling. It wasn’t until much later that I came to see how, on average, young men of color often don’t get as much leniency as I did. Moreover, their neighborhoods are also not patrolled in the same way that mine was, even though there was plenty of illicit activity going on.
The Isolating Power of Systemic Racism
I have spent the last 10 years 3,000 miles away from Richmond, working in one of the wealthiest and most “liberal” parts of the entire country, and sadly, you can still find the exact same patterns of systemic racism.
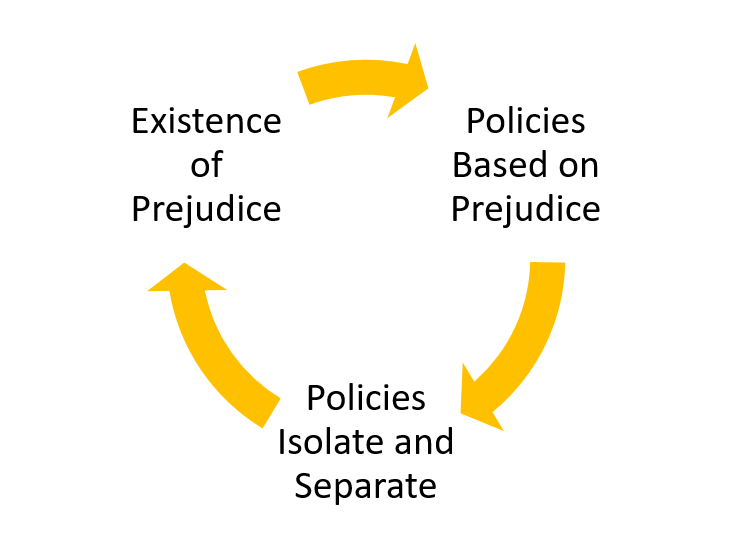
If legal segregation was outlawed over 50 years ago, why is there still so much inertia behind these systems? The explanation is extremely powerful feedback loops.
There are more obvious feedback loops, like my own life-story, which is an example of common systemic pattern called success to the successful.

For those of who benefit from this cycle, it looks so easy. It’s three simple steps. But that’s the even deeper evil.
When I look at the maps in this article, when I understand how neighborhood composition developed in the way that it has, and when I reflect on how those neighborhoods have very different experiences (with school, with police, with economic opportunity, with access to cultural and environmental resources), well, I see my privilege, and I feel compelled to act.