
Unless you’ve been on a social media diet, if you’re a place-lover or city-nerd, you knew last week was D-Day for cities vying for some Amazon love…and boy are cities chomping at the bit – 238 to be exact – all over, not only those in the U.S., but also plenty of contenders from our lovely neighbors to the north, Canada. Clearly, the media’s been abuzz with who will win over Amazon’s heart (ahem, second headquarters). The promise of 50K jobs and $5B+ of investment is a big part of why cities – of all shapes, sizes, and inclinations – are chomping at the bit to lure the likes of Amazon – talk about a debutante!
Amazon’s inquest for its new headquarters feels decidedly different than the heretofore economic development playbook status quo. They aren’t just looking for who can make them an “offer they can’t refuse” – they are purposefully looking for a city that they can “settle down with” for the long term – and for that to happen, cities need to offer more than just incentives or subsidies. In order for Amazon to bring this new city back “home” (to the board) and get their blessing, it’s gotta have the whole package – and today, “quality of place” is a key part of what corporations like Amazon are expecting from their existing and new homes.
AS CHARLOTTE ON SEX IN THE CITY ONCE SAID, “WHERE IS HE?” – WELL, FOR AMAZON, THIS IS WHO IS HE (OR SHE)!:
- A city within a metropolitan region with over 1M in population (i.e., populous “dateable” workforce)
- Stable, business-friendly environment (i.e., potential for long-term, committed relationship)
- Urban or suburban locations with the potential to attract and retain strong technical talent (oh, come on, we’re all looking for someone with that “je ne sais quoi”)
- Communities that think big and creatively when considering locations and real estate options (yes, let’s jump out of that airplane together – or disrupt an industry or two)
Playing the Field But Looking for the One…The New Needle in a Haystack…
So your friends convince you to put a profile up on Tinder. You swipe right. You swipe left. Admittedly, willy-nilly. Something in her or his eyes. And then there’s like matches! Now what? Or, if you’re as old as I am, you spend way too much time crafting your profile (think, clever RFP), and then amazing – you get responses. But um, like there’s way too many. Honestly, I’m not trying to be trite. This is not all that different from how cities choose winning proposals…and tenant reps decidedly struggle to quantify the “soft amenities” that corporates are looking for from sites. I know E-harmony seems a bit old-skool (relatively), but there’s clearly something to be said about using data to inform who’s “right for you” – think about it, you don’t think twice about Amazon (or Netflix, Spotify, etc.) recommending new books or gadgets for you based on your previous purchases, viewing history, or reviews. In fact, you count on it – and are often creeped out about how “right” they are. So shouldn’t large corporates – ahem, like Amazon themselves – be using similar tech to guide one of their most important, costly decisions ever?
And we – all modesty aside – strongly believe we are the only ones positioned to help the likes of Amazon harness the power of urban design data and predictive analytics to “cut through the noise” and implement a quantitative approach to help sift through all those would-be-suitors and find their perfect match, without, yes, having to kiss many frogs.
So today, we’re previewing our modern-day, data-geeky version of a Jewish “Yenta” to show how the likes of Amazon can use State of Place to wade through of all the proposals, new websites, attractive slogans and “indecent proposals” – to objectively evaluate who truly “measures up.” We thought it would be fun to see how an admonished “Goliath” (i.e., Denver according to the New York Times) would fare compared to a well-known and endearingly cheered underdog (you know you love them, Detroit).
Let the (Data-Fueled) Battle Begin!
HERE’S WHAT WE DID:
- Collected data (via Google StreetView) on 290+ built environment features (crosswalks, curb cuts, vehicle lanes, sidewalks, etc.) on four blocks outlined by Detroit in their RFP and a sampling of three blocks in one of the neighborhoods that Denver likely proposed in theirs.
- Calculated “David” and “Goliath’s” State of Place Index (using our proprietary algorithm to aggregate the raw data into a scale from 0-100). The Index creates a benchmark of the current quality of place of each area’s existing conditions. (Are you a 90 or a 50…this is the conversation starter – or not.)
- Generated the State of Place Profile, which breaks down the Index into ten key urban design amenities that most Americans are looking for today from their homes and workplaces. The Profile provides a deeper dive into what amenities each site has and helps determine if there is a proper fit. (Do you both like to go hiking on the weekends – or are you more of the urban/social type and they’re more the relaxed/Netflix and chill type?)
- Ran a Sim-City style analysis that quantifies what the State of Place Index would be if Amazon were to choose Detroit (based on development proposed in their RFP) vs. Denver (based on a similar set of changes). Here’s where it gets interesting – so if the city became its best self, what would that do to its initial score? (Classic ugly duckling turns into a swan story – only we can predict and quantify it!).
 DENVER, THE GOLIATH
As the New York Times’ HQ2 frontrunner, Denver certainly has a lot going for it. Its young vibe, for starters, would be a great fit culturally for Amazon. After all, its population’s median age is only 34. However, the locals are worried that residential real estate prices will go up.
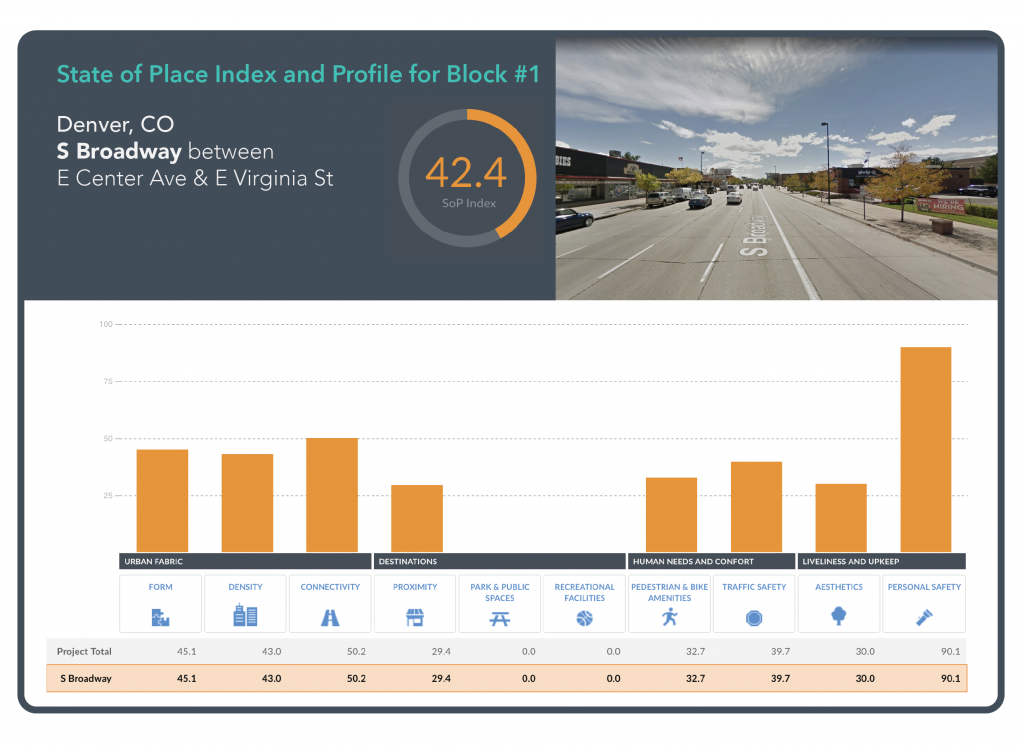
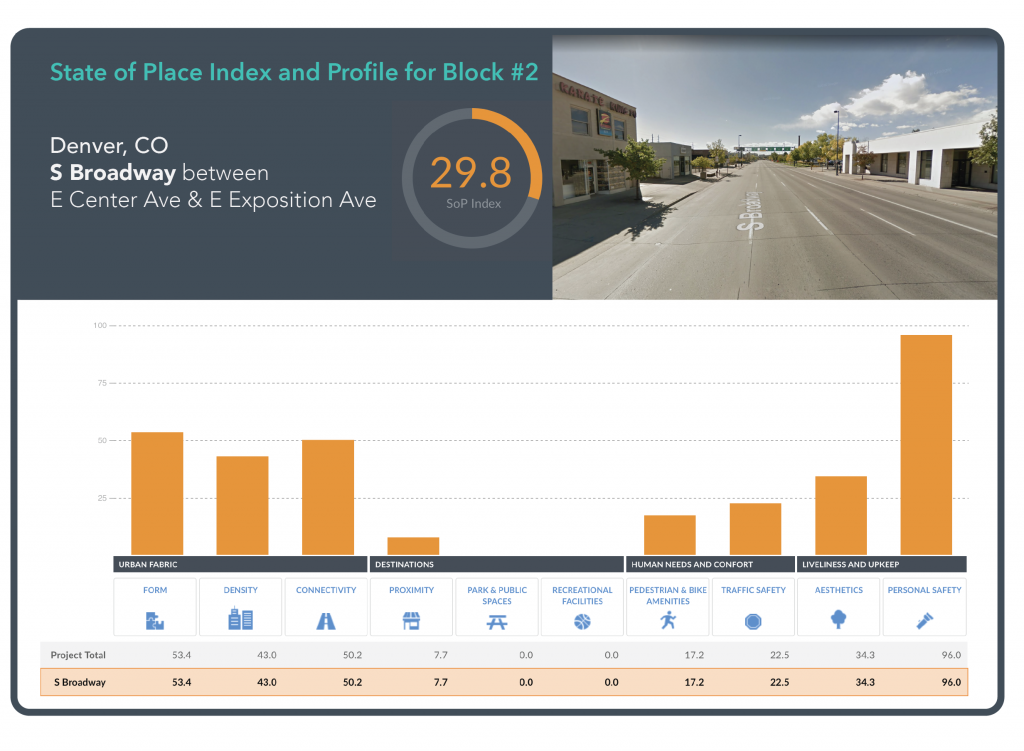
Denver’s proposal has been kept under tight wraps, but according to the Denver Post, the city has submitted eight potential sites for HQ2. We picked one area near the Denver Design District on S Broadway and calculated the State of Place Index and Profile for three blocks in the area. Here’s how this area currently scores in terms of walkability and livability (tip – scroll through all four blocks to see how changes to each would impact that particular block’s State of Place):

For the State of Place future scenario analysis, we made a few development assumptions:
- Assumed new buildings in Denver would be mixed-use and would range between 4-8 floors for residential and 9-12 floors for office and commercial space.
- Widened the pedestrian sidewalks and added bike lanes, as the site is close to a river and two parks.
- Added parks, eliminated surface parking lots, enhanced the permeability of the streetscape.
- Added a mid-block zebra crossing with stop signs (as these blocks are quite long).
- Added medium-to-large street trees to cover 25-50% of the sidewalk.
- Added pedestrian islands in the middle of the road and extra pedestrian islands in blocks #2 and #3.


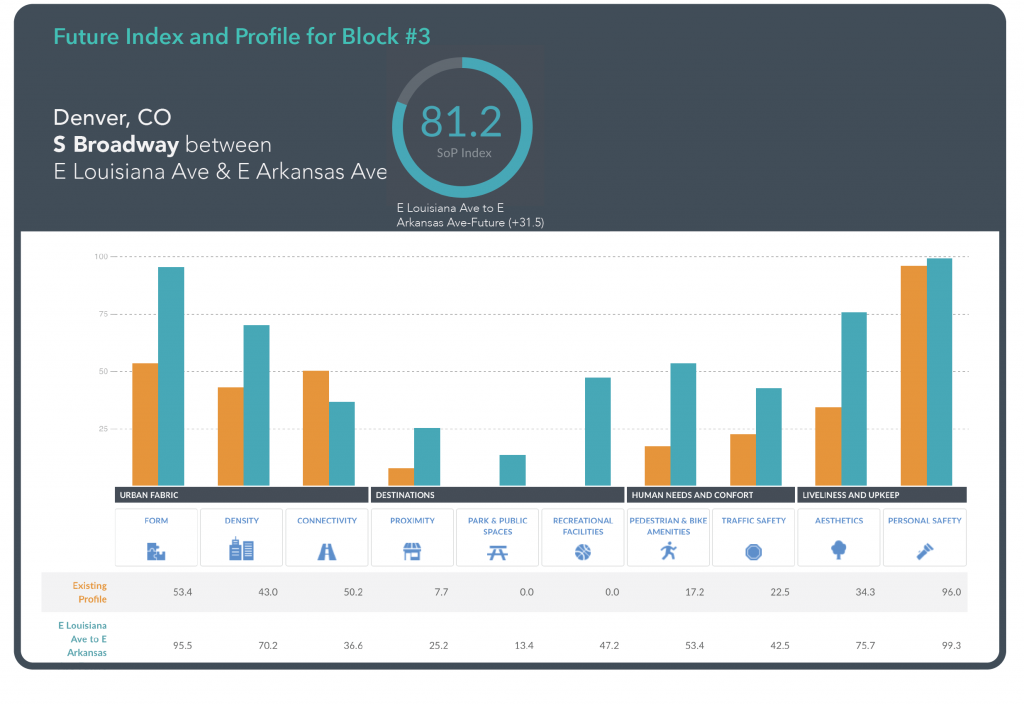
On average, Denver could improve its State of Place Index by 40 points if they were to implement these changes as part of their RFP for Amazon (ranging from an increase in 31.5 to 52.7 points across the three blocks). In particular, there are significant gains in aesthetics, parks and public spaces, pedestrian and bike amenities, and the overall urban fabric – all amenities that would help attract the kinds of newcomers Amazon would be keen to add to their team.

DETROIT, THE DAVID
Detroit has submitted an ambitious proposal, allegedly applying both as a domestic and an international location (hey, Canada!). With the motto “Detroit Moves The World,” the proposal announces that “with space to grow, collaborate, and thrive, Detroit is a city unlike any other.” The city’s pros include great airport connection, research universities nearby, plenty of land for development and housing, and a city and businesses willing to collaborate with the tech giant. Playing a pivotal role in Detroit’s reinvention would be a branding plus for Amazon. Cons include lack of public transportation and a comparatively weak image of the city.
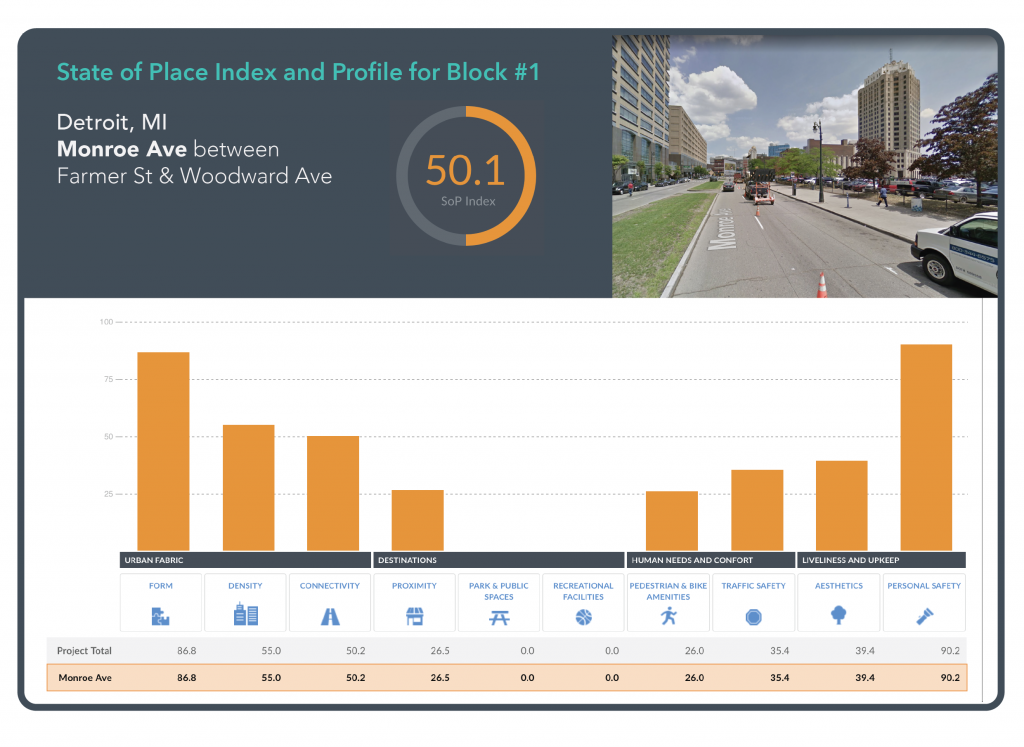
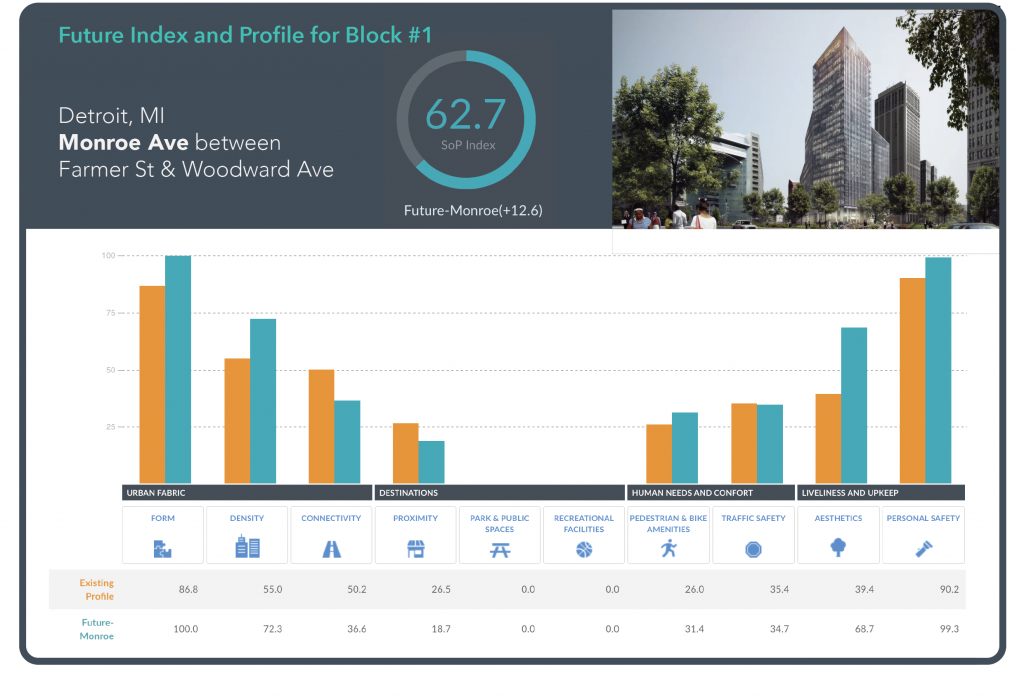
For the State of Place analysis in Detroit, we picked an area near Monroe Block with a 35-story tower to be built on Monroe St in downtown (818,000 square foot office). Here’s how this area currently scores in terms of walkability and livability.
A few development assumptions in Detroit:
- We didn’t touch the “hard to change” design features, such as a number of road lanes or the shape of the road curve. Neither did we change biking conditions.
-
Left the average height of the buildings as is, as the area is already surrounded by tall buildings.
-
We adjusted curb cuts, added automated pedestrian signals, a zebra crossing, and pedestrian count signals.
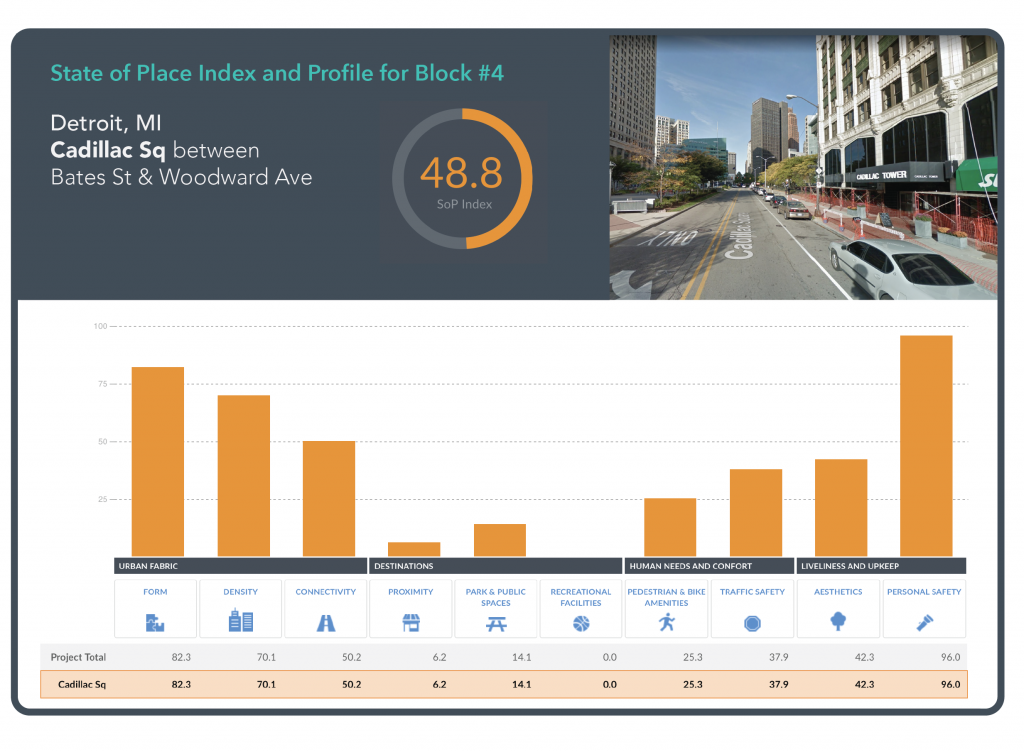
- On Cadillac Sq, we added a mid-walk crosswalk.
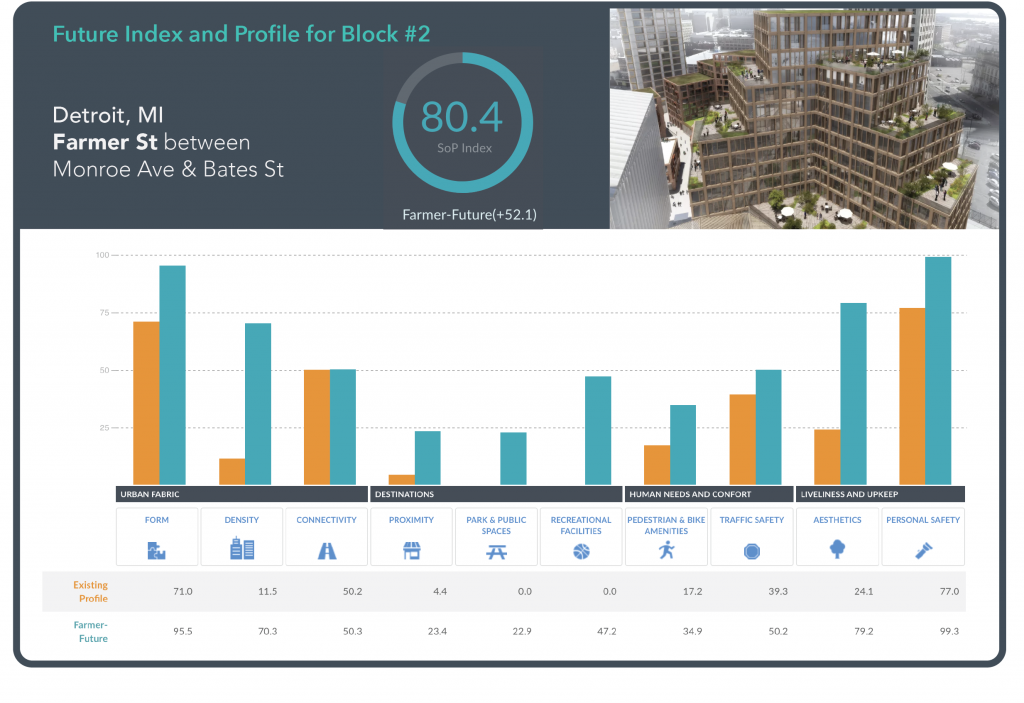

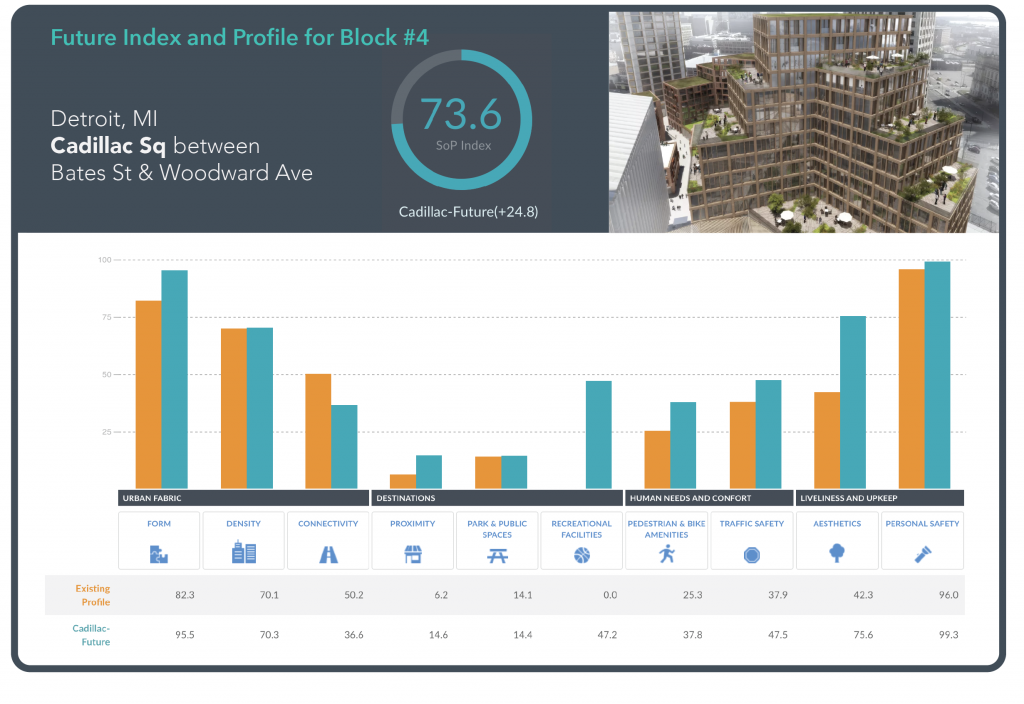
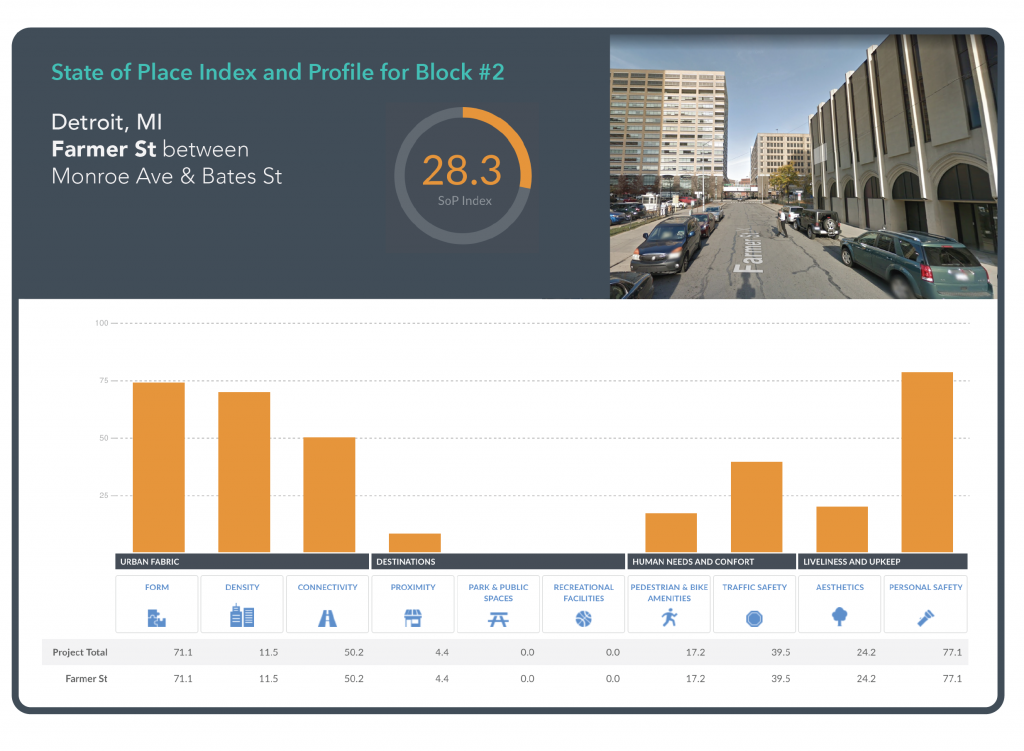
On average, the changes proposed to this area within the Detroit RFP get it 30 points more on the State of Place Index. In particular, Block #2, which gained an impressive 52 points, sees huge improvements in the number and mix of places that workers would be able to walk to from the Amazon campus, more parks and recreational activities to get those creative juices flowing, and a safer and more pleasant environment.
I Now Pronounce Denver and Amazon the Perfect Match???
Overall, Denver fared better in our Sim-City style scenario analysis – an increase of 40 points overall vs. 30 points for Detroit. But, it’s important to point out that one, their existing conditions on average across all blocks surveyed (40.6 for Denver and 39.9 for Detroit) are pretty much the same, and two, we might have been a little overzealous with our particular plans for Denver! (why are you keeping this so secret, Denver!).
So what does this tell us?
- Don’t judge a book by its cover. In reality, from an urban design perspective, Denver and Detroit are on similar footing. So it would be wise not to underestimate what Detroit can offer today – even without implementing its very ambitious plan.
- There’s more than meets the eye. It’s not just about the first impression. It’s important to dig deeper and understand what kinds of amenities are on offer – and if those are indeed what you’re looking for. Not all blocks with similar overall scores are created equally…
- There’s a reason why brides do a trial makeover before their big day (take it from this recent newly-wed!). Architects and planners often have big visions for how to improve a place – and they create beautiful, engaging – enticing – pictures. But are these the right changes? How much of an impact will a proposed project really have? Will they help in achieving the bottom line – attracting and retaining the right talent? Why not actually – objectively – vet the effectiveness of the proposed RFP (test that makeover!)
Bottom line? Don’t discount Detroit (or any of the other underdogs in the list of 238 proposals)…and don’t automatically inflate the favored contenders. Put the Davids and Goliaths on equal footing – and vet them objectively to ensure that fairytale ending. Check Out The Full Report Here