
Thanks for joining me for another week of Data Stories.
This week’s Diversity Dashboard Hot Topic is Generations!
As we dive into the data this week, we are looking at the age distribution of local leaders and how we can expect to see these numbers change over the next few election cycles. Most of us are aware of the large generational gap in the representation of government officials in this country. Our baby boomers are no longer the largest generation but still comprise the majority of elected offices. As the gen X and millennial cohorts start filling the positions of retiring boomers, what will this transformation of power look like?
-
Born between 1980 and 2000, millennials overtook boomers as the largest segment of the U.S. population in 2015 but are led by a federal government that currently holds the highest record of officials over 60 in US history.
-
80% percent of the U.S. House of Representatives and 86% of the Senate are aged 50 or older
-
Today, just 17 percent of federal workers are under 35 years old; in the private sector, almost 40 percent are under 35.
Re-elected in 2015 with 89% of the vote, Svante Myrick is the 30-year-old mayor of Ithaca, NY who uses social media to crowdfund city projects. He hit the generational divide nail on the head when he said, “the youngest generation is pretty sure that we can do it better than the folks that have been doing it for a long time. And the folks that have been doing it for a long time are pretty sure that the youngest generation has no idea what we’re doing.”
-
According to Run for Something, a new Democratic-affiliated political organization aimed at recruiting young candidates, over 11,000 millennials have asked about running for state and local office.
-
60% percent of the congressional staff is made up of millennials under age 30, showing that millennial input is having an influence.
-
Gen X cohort will likely take power before millennials; are we concentrating enough on this group and their potential for large impact in government? Check out this great article by Governing.
So what does the data in our own Diversity Dashboard show? We are seeing that a third of our leaders who responded to the survey are in the gen X or millennial age group.
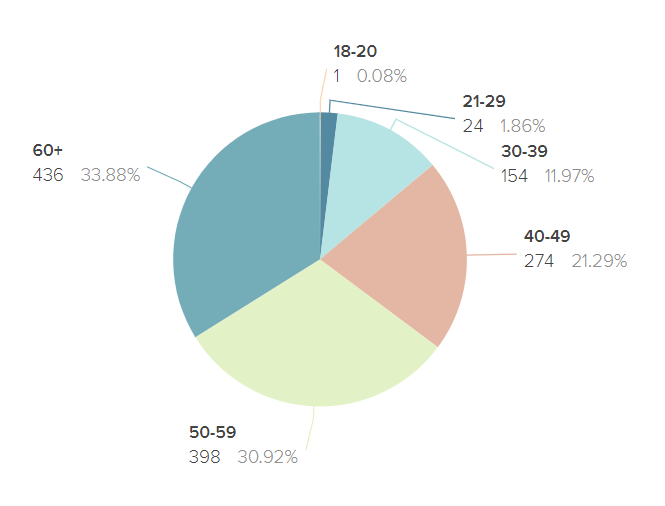
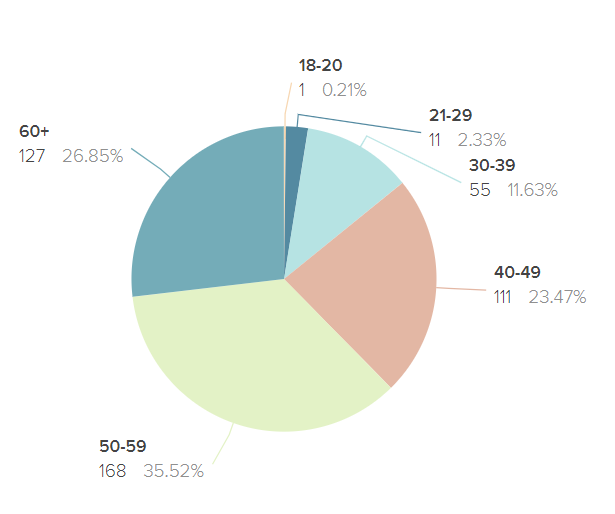
What does this look like for female leaders? Pretty much the same.
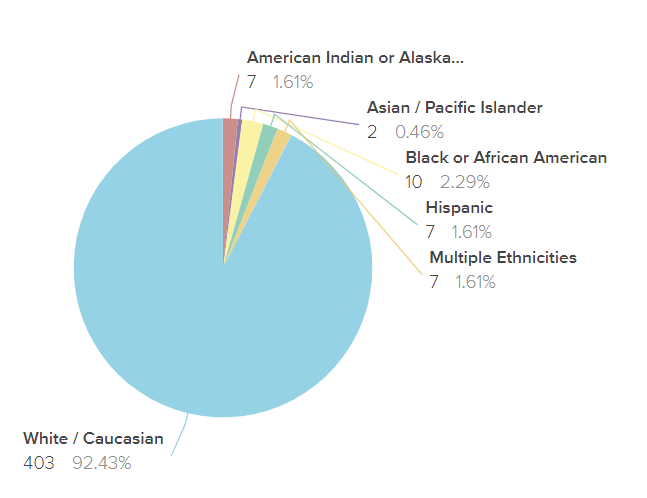
What if we look at the race and ethnicity breakdown by age group?
The overwhelming majority of respondents were over 50 years old. And white.
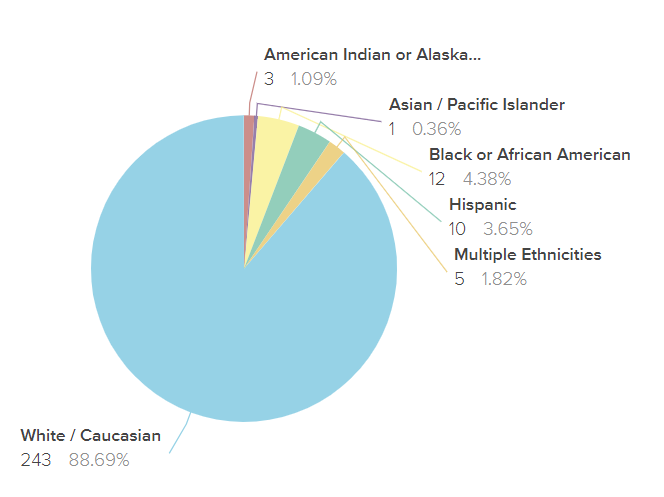
Below is the 60+ age group.
Are the younger age groups anymore diverse?
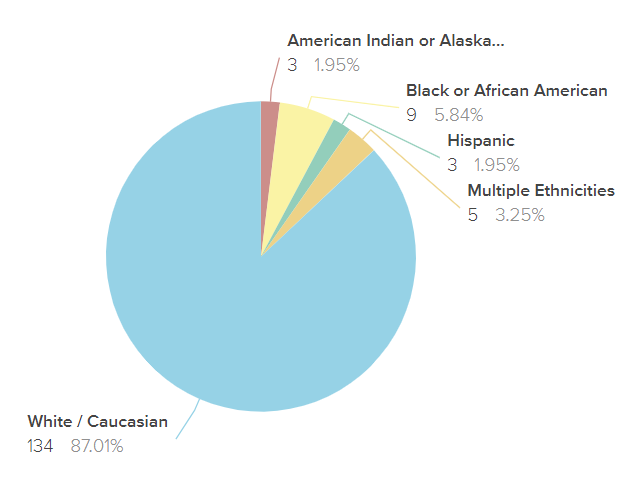
50-59 age group…no change…just slightly more white.
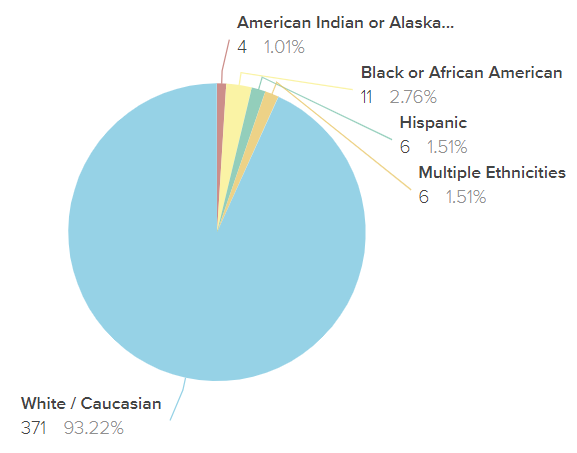
40-49? Here’s something. Diversity up by 5%.
30-39? Another 1.7 percent of diversity gained.
These are apparent trends that show as we get further from the baby boomer generation, there is an increase of diversity. With only 12 respondents in the age range of 18-29, there is not enough data to show trends. But as we continue to compile more and more respondent data, and with a few more election cycles, it will be exciting to see how the generational divide evolves.
Thanks for joining me again this week. I would love to hear your thoughts and suggestions for more data digging. Shoot me an email: matthias@ELGL.org
See you next week!