
Welcome back to another week of Data Stories!
Today I want to talk a little about terminology. Specifically, the language around leadership and the expectations we have culturally constructed around positions of leadership. As we look at the gender of those in power in this country, and around the world, there is a male-centered narrative that most countries have held for entire political histories. We know change is in the air, and our Midterms coming up will be evidence supporting the 2018: Year of the Woman claim.
But here at Data Stories, we use hard data to come up with our insights and it does not make our job easy when we have large holes in our responses. Of course you can check out a previous blog about no responses but when I see this chart below of the gender question in our Diversity Dashboard survey responses its easy to speculate why such a simple question would be ignored almost a quarter of the time. The 13 “not listed” responses represent currently vacant positions, but the quarter 25% that chose not to respond had no similar reason for ignoring the question.
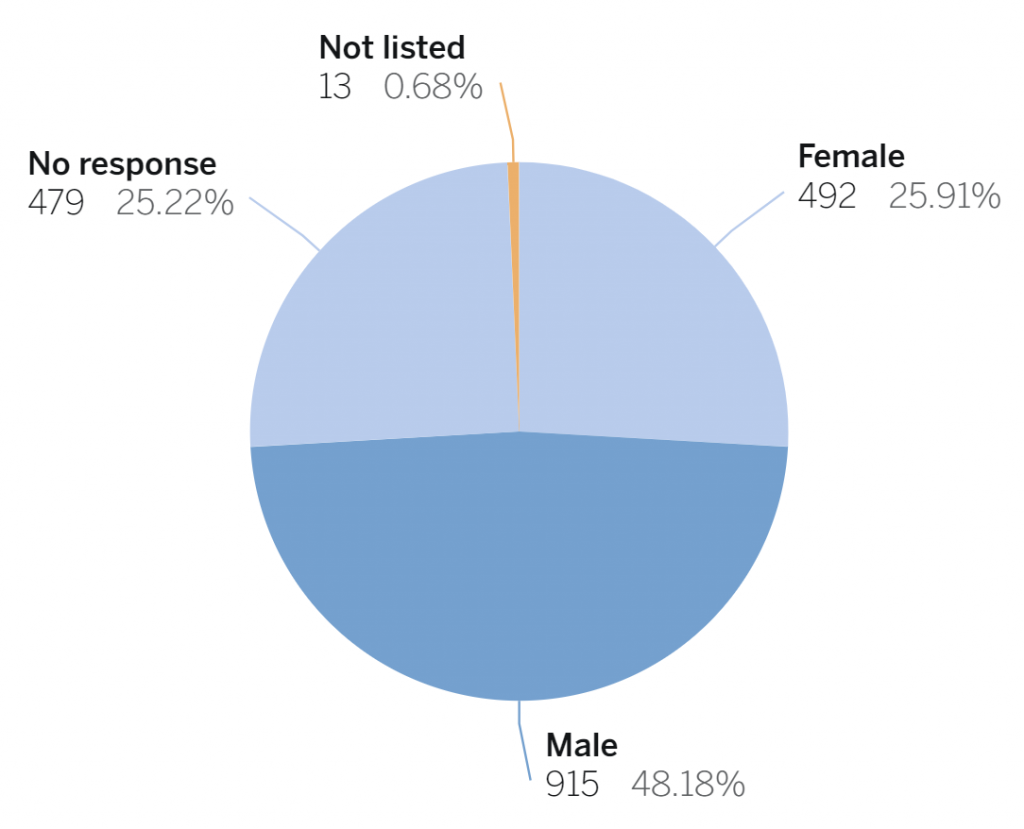
So when we look at any questions regarding the female leaders surveyed, it’s hard to not wonder about that quarter of the pie graph above that chose not to disclose their gender. I told a colleague recently that it makes me wonder if all those “no responses” for gender are being made by men not wanting to show how male-dominant their municipality’s leadership is. I have a hard time believing that many of those blank responses are women thinking they would rather not disclose their gender. The Diversity Dashboard survey does, by definition, summon an obvious objective- to see how diverse (which we read here as “good”) or not diverse (which we read here “not good”) the municipality’s leadership actually is. Here we can note how gender individuals in leadership positions is culturally or socially represented and therefore, constructed, because the majority of Americans in any position of power are male. If you have time, check out these great articles to go deeper.
Faces of American Power (NY Times)
Women in Management (Catalyst)
Women’s Leadership Gap (Center for American Progress)
Of course, data work does not pay much attention to speculation. Instead my colleagues and I have decided to start looking into those 479 “no responses” and look up the answer on their municipal websites—if you are a government leader, it is likely your gender identity will be found with a basic google search. I’ll let you know in the next blog what this simple methodology brings us. Until then, I would like to next look at what we can learn from our current data regarding females and the roles they are most likely to play in municipal leadership.
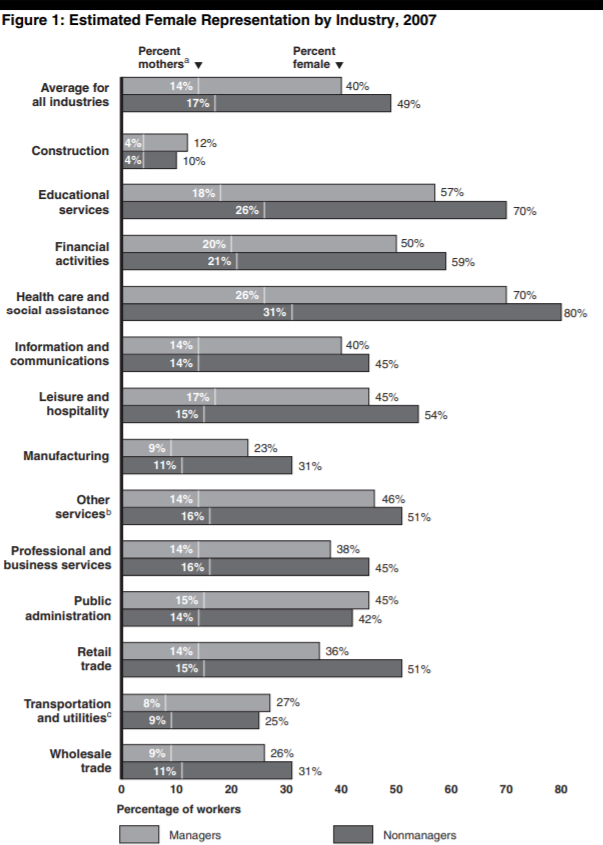
This 2007 chart from Center for American Progress shows the percentage of female “managers” and “non-managers” in various economic sectors. In education and health care, female managers outnumber their male counterparts. Yet in most sectors, this is not the case.
Positions of government leadership held by females are also quite varied from male leaders. Check out the Diversity Dashboard chart below showing the names of these female-held positions.
Diversity Dashboard Leadership Positions: Female Respondents
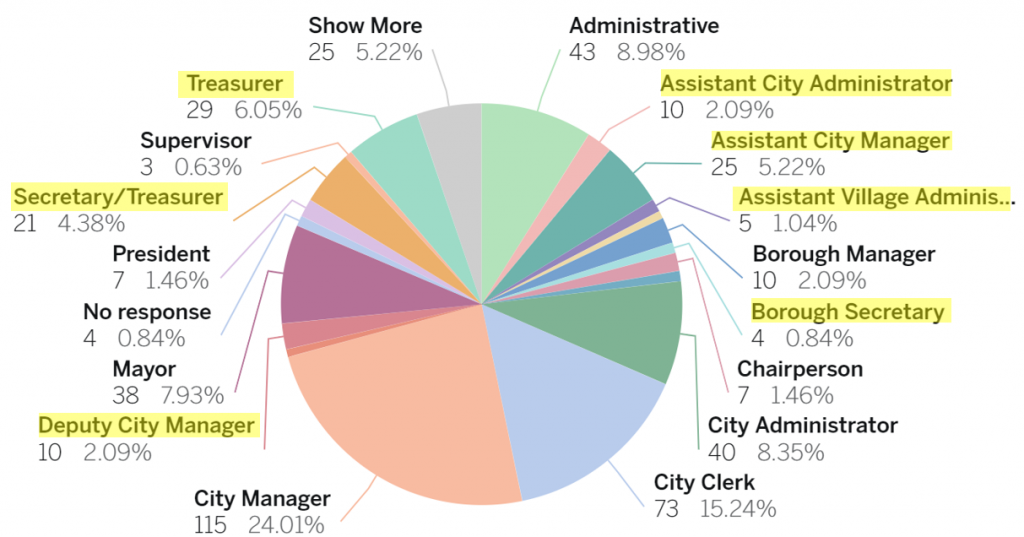
Highlighted on the charts are what positions might be deemed more ACAO leadership roles than CAO roles. If we calculate the number of assistant positions given versus those with executive authority, almost 22% of these positions are second or lower in command. When we look at the same responses by male leaders, there is a BIG difference when comparing to female leadership roles.
Diversity Dashboard Leadership Positions: Male Respondents
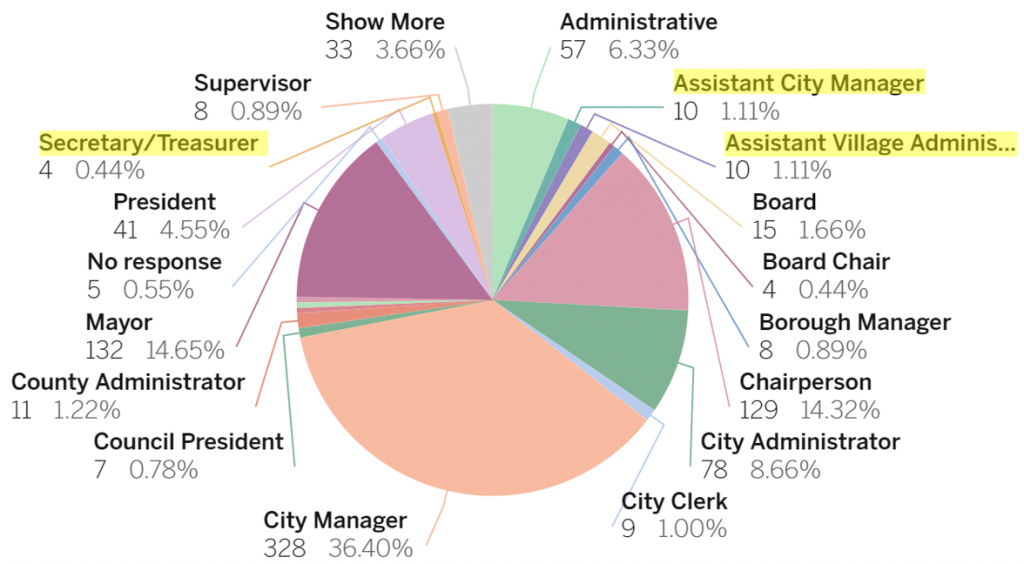
The subordinate leadership roles make up a mere 2.66% for the male respondents.
Its this type of digging into the data that helps us see how much further women have to go to be in comparable positions of power. A graph from a 2017 State and Local Gov Review report titled Women in Local Government: What We Know and Where We Go From Here provides some great insight into the historical movement of women in mayoral or managerial roles.
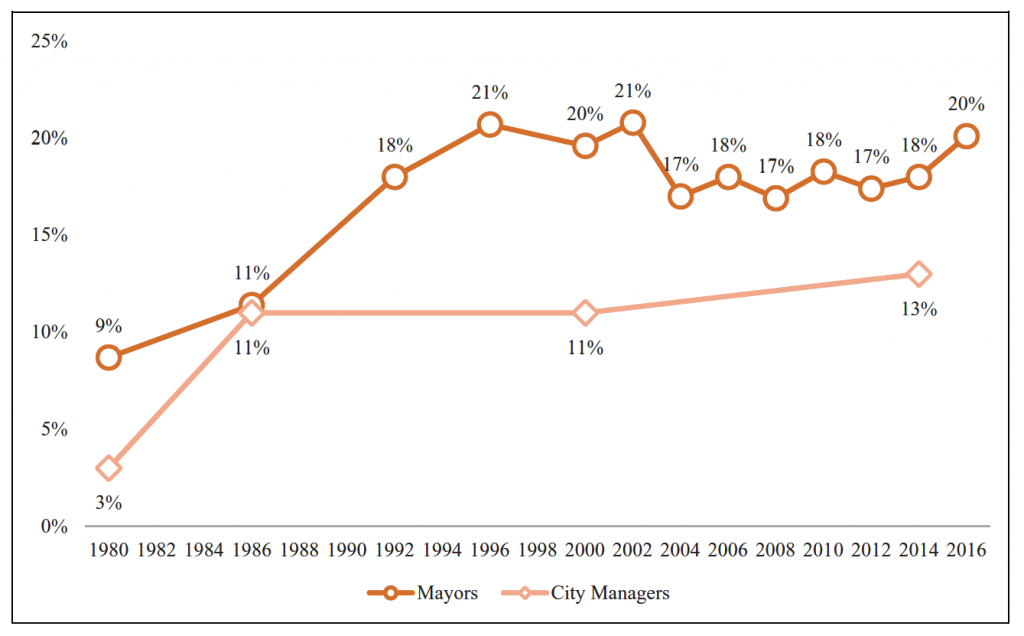
At more than 50% of the national population, female municipal leaders still comprise only 20% of these roles, and this has remained relatively unchanged since 1992, same year Anita Hill testified against Justice Thomas and the same year women had a record-breaking year winning congressional seats. How has that percentage remained unchanged for a quarter of a century? According to this same report, women account for only 14% of municipal CAOs. The “where do we go from here” question this report answers is maybe why this blog exists: “Despite the opportunities for gendered analysis at the local level, political science, public administration, and urban studies continue to see the limited research on women’s representation in local politics in the United States.” So we are here. The Diversity Dashboard is here. Other projects are making a difference too. The Gender and Multi-Cultural Leadership Project and Local Elections in America Project offer benchmark data and templates to promote transparent data gathering regarding gender composition in our political landscapes to bring national attention to the gender gap.
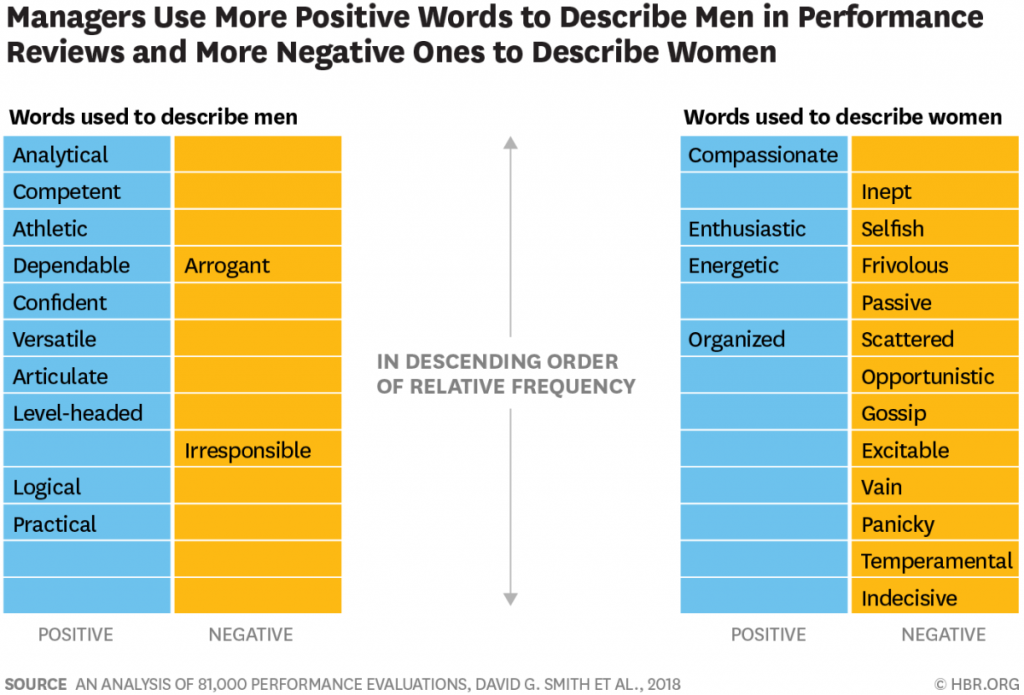
The 2017 Women in Local Government report includes evidence of cultural and social constructs that promote the image of a CEO or executive leader as male, white, and middle to older aged. Much of the terminology around executive positions is assumed male (and white) until proven otherwise. This can be found in other social and career sectors. For instance, a friend of mine told me last week how her role as an executive chef in an up and coming new Denver restaurant is being touted in press as the new “female head chef” and interviewers only want to pursue the gender angle instead of her professional experiences or influences. The feedback we receive throughout our careers also catalyses vast differences in the skills or character traits in women and men that elicit praise, further cementing an expected path. Harvard Review looked at the terminology used for performance reviews in the US military and it’s pretty revealing. Read the whole article here. As you can see in the chart from the article, the study analyzed a large-scale military dataset (over 4,000 participants and 81,000 evaluations) to examine “objective and subjective performance measures that included a list of 89 positive and negative leadership attributes” to assess leader performance in a military leadership setting.
It’s hard to imagine a wide-reaching transformation that brings an increase in female CAO representation when most of us still imagine a man rather than a women when asked to picture a leader. Constructs are powerful, even when our values differ. And calling out our own biases is a great start for large scale change.
As we continue to raise the questions of gender representation and as our political and social climate heats up around the Kavanaugh-Ford hearing and the larger #metoo and @womensreality conversations, it is exciting to think that there is a role for data narratives to bring a heightened focus to gender inequalities by spreading informative and verified content that cannot easily be ignored or deemed #fakenews.
Thanks for joining me for another installation of Data Stories! Before I sign off, I’d like to leave you with this excerpt from the Harvard Business Review:
“One of the things that’s ironic about our findings is that many of the leadership traits that people say they most appreciate, want in a leader, or make a successful leader are the positive traits — such as compassion — that women leaders receive in their performance evaluations. So why isn’t this translating into more women in these roles? It’s one thing to describe an ideal leader, it’s another to describe a real person’s performance without being influenced by stereotypes about their gender, or stereotypes about what a leader should be.
Because of widely held societal beliefs about gender roles and leadership, when most people are asked to picture a leader, what they picture is a male leader. Even when women and men behave in leaderly ways among peers — speaking up with new ideas, for example — it’s men who are seen as leaders by the group, not women. And as our study shows, even in this era of talent management and diversity and inclusion initiatives, our formal feedback mechanisms are still suffering from the same biases, sending subtle messages to women that they aren’t “real leaders”— men are.”