
This article is by ELGL member Nicole Bare with Change Research. Here’s a copy of the survey data used for this article.
Change Research surveyed 941 Americans from March 18-30, 2021 about how funds allocated by the recently passed emergency COVID-19 relief package, the American Rescue Plan (ARP), should be spent. The bill gives state and local governments a historic $350 billion to respond to the economic fallout caused by the pandemic.
A majority of Americans believe ARP funds should provide aid to residents and small businesses
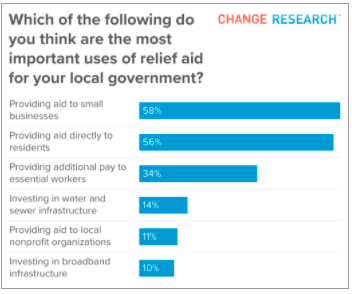 When asked to choose the two most important uses, 58% of respondents chose to prioritize aid to small businesses and 56% chose aid to residents. Providing aid to small businesses is the top priority for 74% of those with high trust in local government, with only 38% supporting direct aid to residents, while 60% of those with low trust in local government support small business aid, 56% resident aid.
Third on the list was providing additional pay to essential workers, chosen by 34% of respondents. This was most important to women (40%), 18-34 year olds (45%), and those who did not vote in the 2020 election (50%).
Investing in water and sewer infrastructure, providing aid to local nonprofits, and investing in broadband infrastructure fell to the bottom of the list for every subgroup at 14%, 11%, and 10% overall, respectively.
Americans split 50-50 on making short-term fixes or long term investments
Half of Americans believe the federal relief should be used as a short-term aid, to address the negative impact of the pandemic now (48%), while the other half believes it is preferable to invest in long-term solutions that will eventually provide a stronger recovery (52%). The younger respondents (18-34) opted for long-term solutions (65%), while those 65+ preferred short-term aid (55%). Interestingly, 65% of those who received unemployment in the past year preferred long-term solutions, compared to only 49% of those who did not.
METHODOLOGY
Change Research surveyed 941 residents nationwide from March 18-30. We used some or all of the following sources to recruit respondents:
- targeted advertisements on Facebook
- targeted advertisements on Instagram
- targeted advertisements on individual websites via Google and/or Facebook’s ad platform
Regardless of which of these sources a respondent came from, they were directed to a survey hosted on Surveymonkey’s website.
Ads placed on social media targeted all adults nationwide. As the survey fielded, Change Research used dynamic online sampling: adjusting ad budgets, lowering budgets for ads targeting groups that were overrepresented and raising budgets for ads targeting groups that were underrepresented, so that the final sample was roughly representative of the population across different groups. The survey was conducted in English.
The survey was administered on behalf of Change Research, and conducted online by Change Research. Post-stratification was performed on age, gender, race/ethnicity, geography, 2020 presidential vote among voters, and education. Weighting parameters were based on demographic breakdowns from the Census and American Community Survey. That is, if a given age bracket or gender group represented x% of all adults, then that same group would be weighted to x% in this survey.
The modeled margin of error* for this survey is 5.0%, which uses effective sample sizes** that adjust for the design effect of weighting.
* We adopt The Pew Research Center’s convention for the term “modeled margin of error”(1) (mMOE) to indicate that our surveys are not simple random samples in the pure sense, similar to any survey that has either non-response bias or for which the general population was not invited at random. A common, if imperfect, convention for reporting survey results is to use a single, survey-level mMOE based on a normal approximation. This is a poor approximation for proportion estimates close to 0 or 1. However, it is a useful communication tool in many settings and is reasonable in places where the proportion of interest is close to 50%. We report this normal approximation for our surveys assuming a proportion estimate of 50%.
** The effective sample size adjusts for the weighting applied to respondents, and is calculated using Kish’s approximation (2).
(2) Kish, Leslie. Survey Sampling, 1965.