Welcome to another installment of Data Stories! I’m excited to explore candidate diversity with you this week. As Midterms gear up toward November 6th, there are a number of races that are pushing 2018 to the highest level of candidate diversity – ever! So what does this look like, exactly? What insights can we find in the numbers?
In a 2018 Kaiser Family Foundation poll, 40% of women 18-44 said they are “more enthusiastic” in voting this year than in previous election years. In 2014, that response was only 14%.
FiveThirtyEight reported that there is a 24-point gender gap that “favors Democratic candidates”. In fact, the polling website goes further, noting: “If women were the only ones who voted, races that are closely contested now would turn into Democratic blowouts, today’s safe Republican seats would turn into toss-ups, and Democrats would win the House popular vote nearly every time.”
US Congress is seeing exponential increases in women running.
In 2014, there were 159 women nominees for the US House, with 84 winning (62 were Democrats).
In 2016 that number grew to 167, with 83 winning (63 were Democrats)
This year 476 women ran in the primaries, with 235 winning major party nominees for US House seats. 183 Democrats and 52 Republican.
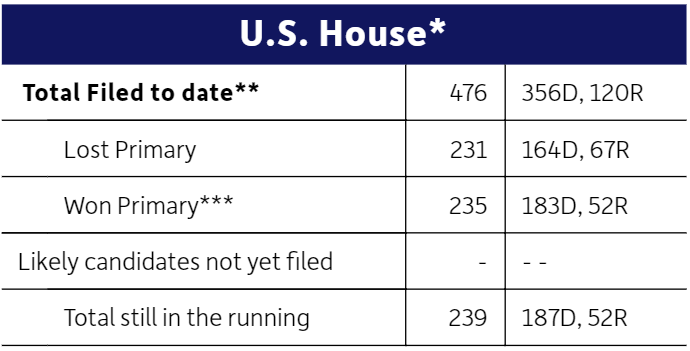
So where are these wins for #diversity coming from? And how far have we come? Center for American Women and Politics (CAWP) have been reporting women candidates for Congress since 1974, and believe me, we have come a long way from that year’s US House races, with only 44 women nominated, and 18 winning (14 Democrats, 4 Republicans). CAWP has a great summary of these findings here.
The US Senate is also seeing changes in diversity in recent election cycles.
From 1976 through 2000, the number of women nominees for US Senate never reached more than 11, with an average of 6 each election. The number of winners during this time was very low, with an average of only 1 or 2 wins per election cycle.
Lets fast forward to the last three election cycles. In 2012, a record number of women candidates was 18, with 11 wins (10 Democratic). 2014 saw 15 candidates with only 4 wins (3 were Republican) In the volatile 2016 election year, 16 candidates brought 6 wins (5 were Democrat).
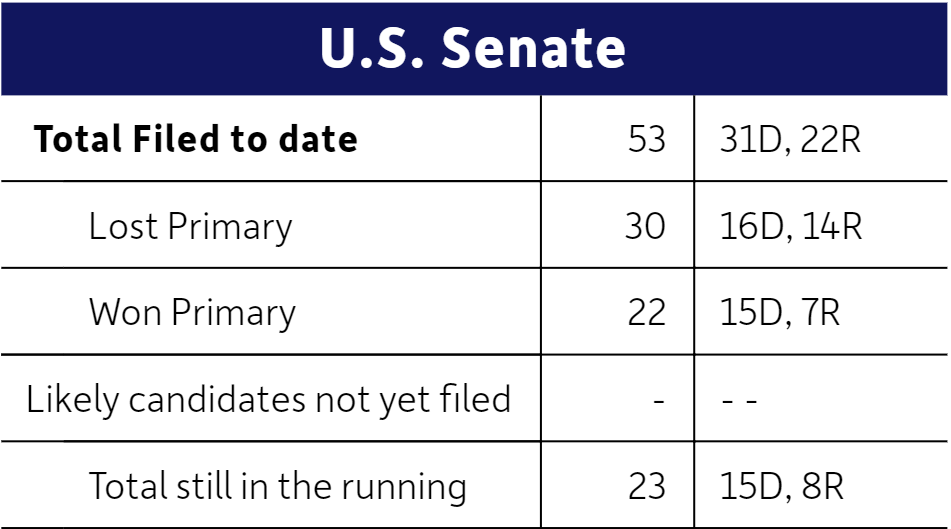
But 2018 is already beating the 2012 record easily. Fifty-three female candidates for Senate have already succeeded in winning 22 primaries.
With women winning also winning big in primaries for House and Governor races, we can see a momentum building across the board.
Currently with women making up more than half of the population, only 6 states have female governors. And only 1/5 of Congress are women. But the numbers show change is in the air! And results have already started validating that narrative.
As we can see in this table, the gubernatorial races are also seeing a large number of female candidates.
We had a huge win for the LGBTQ community with transgender candidate Christine Hallquist winning the Democratic primary for Vermont Governor. 2018 is being called a “Rainbow Wave” because of a record number of 400 LGBTQ candidates running for office this year. Half of those are state offices, with priorities in local government change obvious.
Gender and sexual expression is not the only tune of diversity in the air this fall. Women of color are also breaking records for nominees in Congress, with 50 POC female candidates on the ballot. This includes the huge gubernatorial races of African American candidate Stacey Abrams in Georgia, and Native American candidate Paulette Jordan in Idaho.
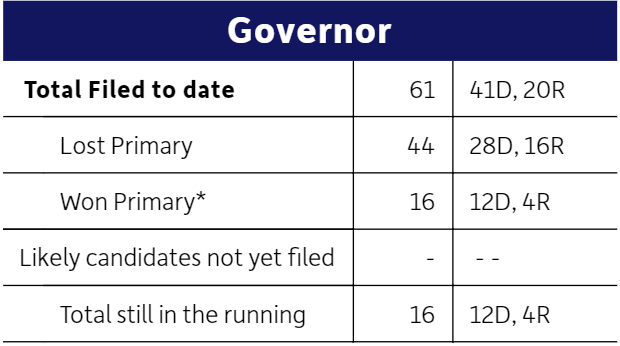
So we are seeing even gubernatorial races teeming with diversity. Sixty-one women filed this year. The previous record of filed candidates was 38 in 1994. That same year a record of 10 women won primaries. This year 16 women are primary winners!
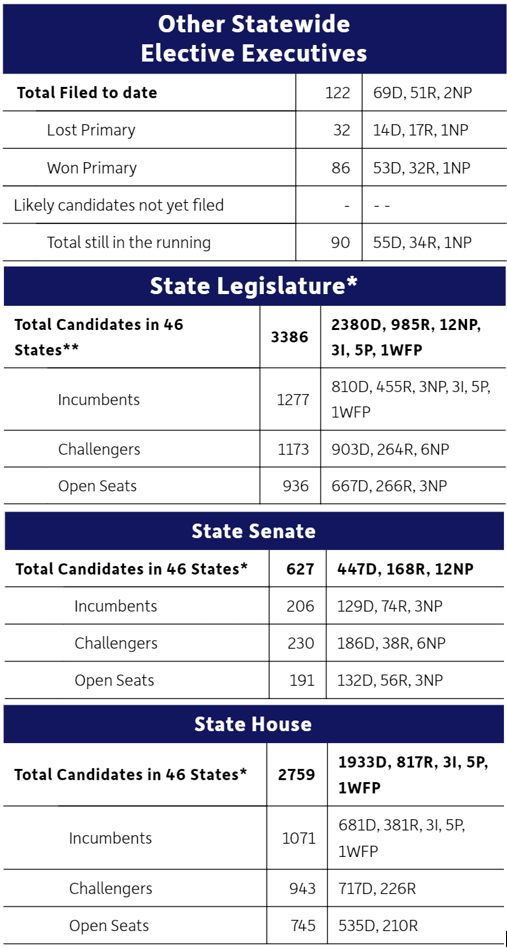
Of course, here at ELGL, we recognize the importance spreading diversity in local government elections. Local government offices are breaking records for the number of women candidates in 2018. CAWP includes a great breakdown of our statewide elections – and shows in detail the record setting numbers in all races.
And that, y’all, is what ELGL and the Diversity Dashboard is all about! We are in such an exciting time and I know many of us are excited to see how the November elections bring new waves of diversity for our communities.
I’ll leave you with a great quote by Kimberly Peeler-Allen, a co-founder for Higher Heights for America who summed up exciting increases in POC female candidates this way:
“In addition to black women wanting to be part of history, people are realizing that regardless of what you look like, the leadership of the country has been predominantly white and male for far too long. Seeing the value of having diverse voices around decision-making tables is not limited to one demographic group, but includes people who want a more reflective democracy.”