Data Download: Measures to Meaning is a five part series by Kirsten Wyatt and Stacy Schweikhart about the recently released data on the numbers of women in local government management, as collected and distributed by ICMA.
Part I: The Data Download
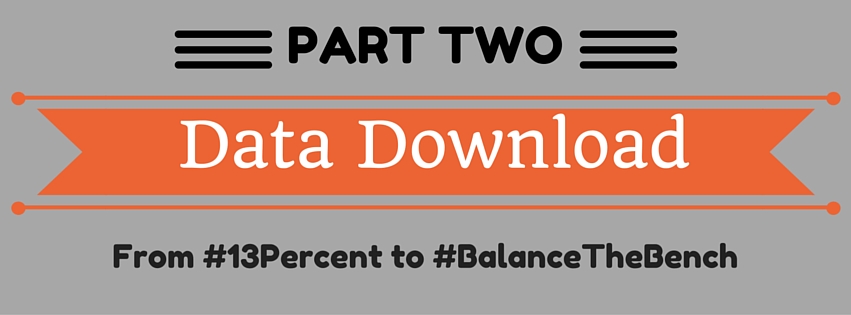
Part II: Finding Meaning in the Measures
Part III: Insights and Ideas Challenge
Part IV: Insights and Ideas Revealed
Part V: ELGL’s Commitment to Leading Progress
Part II: Finding Meaning in the Measures
By Kirsten Wyatt, Executive Director, ELGL &
Stacy Schweikhart, Community Information Manager, Kettering, Ohio
Our goal authoring this series was to bring attention to the #13percent issue in local government and spark a renewed dialogue and passion for progress. It’s fair to say it worked. Almost overwhelmingly the emails, reposts and retweets by colleagues around the country expressed solidarity and support for further exploration of the data. We also received words of caution from ICMA based in the concern that our analysis in Part I compared apples to oranges and thus created misperceptions. For us, both responses are a rally cry.
ELGL will not tiptoe around this challenge. We will not post blog articles that are apologetic for speaking the truth. We know these numbers make many uncomfortable. We also firmly believe that sometimes progress comes from working through that discomfort, not making excuses and backing down from our stance. We believe that this approach will help us #BalanceTheBench – the hashtag we want to use to describe a reality where there’s gender equity in local government management.
This data, this issue, matters.
As we seek to find meaning in the measures, we have more questions than we do answers.

Can we really claim progress?
Comparing apples to apples, female CAO ICMA members have grown from 13% to 15%. On the surface, this is progress. Glacial pace progress, but progress. But if the pace of progress is a 2% gain every few years, it will be 2052 before we reach balance. A consistent ratio of ICMA CAO membership growth will continue to yield a nearly stagnant result. The fuel for a change in trajectory has to be the addition or advancement of new women to CAO leadership roles. Forget the debate on whether the accurate percentage of women in CAO roles is 8%* or 13% or 15%. What’s the growth rate? That’s the number that matters.
Is there more to the story?
 According to National League of Cities, 19,492 municipal governments, and 3,033 county governments can be found in the United States.
With only 3,276 total CAO ICMA members, that means only 14.5% of local governments nationwide are managed by ICMA CAO members.
This blew us away: 85% of local governments are not led by ICMA members.
Could there be more progress out there that isn’t being measured? Would data from state level or other national associations tell a different story? It’s commendable that ICMA is releasing data on their membership. But now, we need other local government organizations – like the National League of Cities and the U.S. Conference of Mayors – to do the same. Then we will really be able to slice the apple.
Why is the ratio better in some states than others?
Our analysis illustrates the disparity in progress among states and specifically examines data for the top ten largest states based on ICMA membership. Here are some observations from the data set:
At the CAO level:

5: Number of states out of the top ten largest based on ICMA membership that have greater than 15% female CAOs.
26: Number of states with less than 50% female CAOs.
23: Number of states with less than #13percent female CAOs.
1: Number of states with a #BalancedBench. Yes. Only one. Three of six ICMA member CAOs in Mississippi are female. (And yes, according to the data, only six CAOs in the state of Mississippi are ICMA members)
At the ACAO level:

37: The national average for the percentage of females in ACAO roles.
21: Number of states exceeding the national average of female ACAOs.
14: Number of states where females comprise 14% – 37% of ACAO positions.
5: Number of states out of the top ten largest based on ICMA membership that have 37% or greater female ACAOs.
10: Number of states with less than #13percent of women in ACAO roles. Scarier data is that 80% of those states do not have any women in the ACAO role.
What’s Next?
Please take a look at the data and let us know what you think. Why are some states doing a better job than others? What other trends do you see in the data? Are there efforts in place that could be replicated nationwide?
We are sure that you have as many questions and ideas as we do. Start jotting them down. Early next week in Part III, we will release a survey that will collect your insights on the data set, and ideas on how best to #BalanceTheBench.