According to the 2017 Homeless Point-in-Time Count, of the 1,100 people experiencing homelessness in Marin, only 15% were employed. Despite this very low rate of employment, of the people who were unemployed, only 23% reported being unable to work. Therefore, there is a tremendous opportunity to help people experiencing homelessness in Marin reenter the workforce.
To that end, the City of San Rafael is excited to announce that in partnership with the County of Marin, Homeward Bound, Downtown Streets Team, and the San Rafael Chamber of Commerce, we will be hosting Marin’s 1st Annual Community Job Fair. This event started as a way to help people experiencing homelessness in our community, but the EVENT IS OPEN TO ALL JOB SEEKERS.
We have received an amazing response from local businesses, and we have maxed out venue capacity with 65 confirmed employers. In this three-part series, Andrew Hening, San Rafael’s director of homeless planning, will discuss the link between employment and homelessness.
The unemployment rate in Marin County is 2.5%. Despite such a strong economy, of the 1,100 people experiencing homelessness in Marin, 85% are unemployed even though only 23% report being unable to work. What explains this disconnect?
Labor Participation

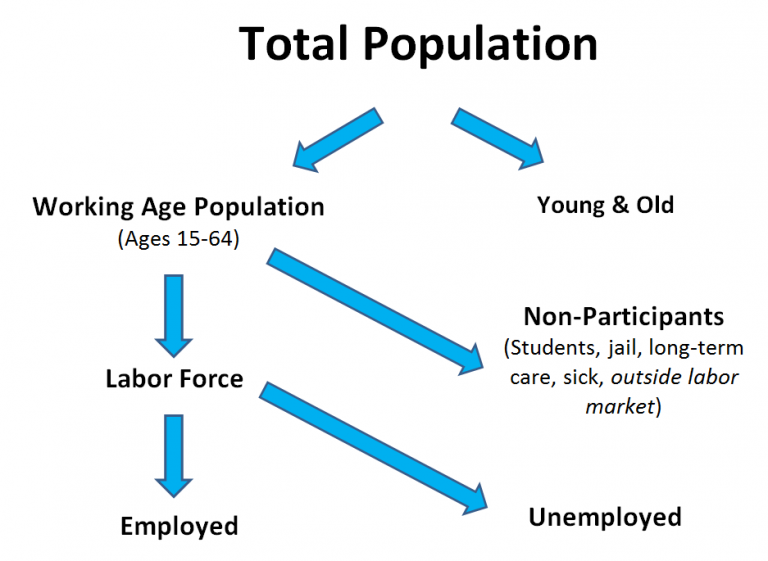
When it comes to measuring the health of our economy, we often focus on the unemployment rate, which is a measure of how many people are NOT working. There is, however, another important measure of economic activity that’s often overlooked – the labor force participation rate.
The labor force participation rate is defined as the percentage of working age people (15-64) who are working or looking for work. Importantly though, if an unemployed person has been looking for work for more than 27 weeks, they are considered a “non-participant” and are no longer counted as part of the labor force.

Following World War II, the US saw a steady increase in the labor participation rate. This was primarily because of more women entering the workforce (female labor participation has doubled from 30% to 60%). However, labor participation peaked in the 1990s at 67.3% and has been falling ever since. As of January 2018, the labor participation rate was 62.7%.

A decline of 4% might not sound like that big of a deal, but consider this, in January of 2018, there were 257 million Americans between the ages of 15 and 64 (the working age population). If labor participation was still at its high from the 1990s (67.3%), then 12 million additional people should have been participating in the economy.
12 million fewer people working is a big deal. That’s like the the ENTIRE POPULATIONS of the following states losing their jobs:
- Wyoming
- Vermont
- North Dakota
- Alaska
- South Dakota
- Delaware
- Montana
- Rhode Island
- New Hampshire
- Maine
- Hawaii
- Idaho
Why?
There has been significant debate among economists about what’s driving the decline in labor participation. In July of 2014 the President’s Council of Economic Advisers (CEA) released a report summarizing 10 of the leading studies on the topic. They argue there are three major trends at play.
Number 1: Demographics – Six million people are no longer working
The CEA report argues that half of the decline to-date has been caused by changing demographics. As we’ve seen, the labor force is comprised of people aged 15 to 64. An individual’s labor participation inevitably declines as they age and look to retire. Therefore, if the labor force tends to be older, participation will naturally begin to decline as those older workers begin to retire (the average retirement age over the last 20 years is 60).
In the mid-1990s, Baby Boomers were half of the labor force, so older, retiring Boomers have had a significant impact on the labor participation rate.

Number 2: The Business Cycle – Two million people are no longer working
The CEA study was looking specifically at labor participation between 2007 and 2014, and the Great Recession in 2008 had a major impact on the economy during this period. By plotting the change in unemployment and the change in labor participation in every state, the CEA was able to draw a trend line showing that there is a connection between unemployment and participation – the more unemployment, the bigger the drop in participation.

It makes intuitive sense that there would be a connection between an economic downturn and participation, but there is an important mechanism to understand. Unemployment itself becomes a self-fulfilling barrier to getting a job again. A 2013 study found that employers are more likely to hire short-term unemployed people with no relevant experience than long-term unemployed with relevant experience. In other words, the longer people are out of the labor force, the harder it is for them to reenter.

Number 3: Something Else – Four million people are not working
The CEA reports that even after accounting for retiring Baby Boomers and long-term unemployment from the Great Recession, there is a “residual” reason the labor participation rate has been declining since the 1990s. Two of the most compelling explanations directly relate to homelessness.
Consider the following, of the 1,100 people experiencing homelessness in Marin in January of 2017:
- 26% had spent at least one night in jail or prison over the last 12 months (versus 3% in the general public),
- 19% had not completed high school (versus 7% in Marin‘s general public).
Number 3a: Criminal Records
There are now approximately 70 million adults in the United States that have a criminal record. Criminal records aren’t just felonies – they include DUIs, drug or alcohol possession, public intoxication, and trespassing (e.g. sleeping on private property). The percentage of Americans with criminal records has significantly increased over time.

Studies across the country have demonstrated time and again that having a criminal record significantly, negatively impacts employment prospects. For example, a study in New York found that even when people had identical resumes, a drug possession conviction reduced call-backs by 50%. Like long-term unemployment, this phenomenon creates a vicious cycle.

Number 3b: Automation
Between 2000 and 2010, the US lost 5.6 million manufacturing jobs. According to a study by the Center for Business and Economic Research at Ball State University, 85 percent of these jobs losses are actually attributable to technological change — largely automation — rather than international trade. In other words, in some parts of our economy, we are producing more than ever, however, we need fewer workers to do that.

Over the last 40 years, the US manufacturing sector has produced more with fewer workers.
While manufacturing might be one of the more obvious examples, communities like Marin that haven’t traditionally had large manufacturing sectors should still be concerned. The consulting firm McKinsey & Co. recently put out a report detailing the continued and accelerated impact automation will have on the global economy. In advanced countries like the US, there will be growth in creative, managerial, and caregiving fields, but there will be even greater downward pressure on physical labor, jobs which have historically had lower schooling requirements. Looking at historic labor participation rates across education levels, it is clear that people with lower levels of education are falling out of the labor force as these jobs disappear.
