Today’s Buzz is by Susan Steward– connect with her on LinkedIn and Twitter!
What I am watching: Game of Thrones (#ARYA)
What I am listening to: Florence + The Machine Mix
What I am reading: Interviews with Maisie Williams about GoT
In my last post I wrote about the delicate balance between being innovative and inundating. I suppose you could consider this Part 2: Return of the Innovation, if I was looking for a wittier title. I struggled writing the last post because I have been excited for this post more, where I introduce everyone to a unique tool I built for the Office of State Treasurer Colleen C. Davis in Delaware to empower residents through financial literacy.
Let’s Talk About Income
Do you remember your first summer job? I do. I was 14 years old, and working in a bathing suit store on the boardwalk. They had offered me 25 cents more than minimum wage, and I was thrilled. Then that first paycheck showed up and I was like, “Um, what?” I was never taught about after-tax pay, or that there was something called “taxable income” vs. “gross income.” Earning the money for my first car was going to be a lot harder than I initially anticipated.
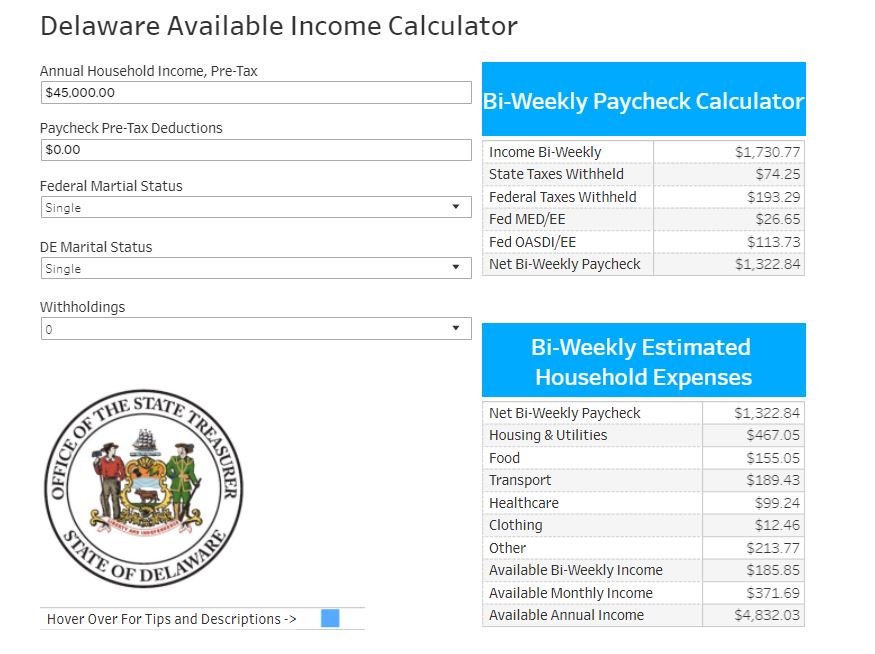
I wish I had known all of the math I know now. I wish I had known where to look for this information, or that something was available for me to calculate and build a savings target. Years later, I still wanted to help others that have limited economic education, and aren’t empowered to negotiate pay, build a household budget, and develop a sense of understanding how policy changes may impact their pay. Thus, the Available Income Calculator was born.
Then that first paycheck showed up and I was like, “Um, what?” I was never taught about after-tax pay, or that there was something called “taxable income” vs. “gross income.”
Communicating Effectively
The hardest part about developing the calculator was finding a platform that could reach a multitude of people while translating high-level concepts into everyday terms. This is where having a great team in place from a policy and communications stand point is probably the most important thing for a government group seeking to create change and innovate. Not having the right people that can communicate the effects/use to those that can message can really hinder the acceptance and reach of the innovation.
Furthermore, the deeper into the project one is makes it harder to take a step back and go “how do others view this concept?” Having a great team to help analyze the perception and communication can provide that insight down to thinking about all types of workers, or even just providing a clear set of instructions for users to follow.
Income to Outcomes
We built the tool in Tableau and released it on April 23. Within hours, nearly 400 people had logged on to use the Available Income Calculator. One of the best comments I received after the launch was that a user liked the integration of a benchmark and savings target for them based on their income/tax inputs. This was our “innovative” piece as there are several calculators out there to estimate a paycheck, but not many connect that “feasible” budget story.
What is often lost in translation of developing good policies and analysis is the true impact to the people. How does this impact a household with one working parent and two kids? How does it impact the senior citizen on social security? We should always consider this but furthermore, how do we as policymakers help empower then to use the programs we create? Does it matter?
Well if a policymaker’s goal is to help change income inequality, perhaps thinking about mobility and opportunity should also be included. The late Dr. Alan Krueger wrote about the Gatsby Curve, or the relationship between the lack of generational social mobility and income inequality. To sum up this theory, the ability of children and individuals that are of low-income to become high-income earners has significantly declined within the U.S. Dr. Krueger encouraged more research in this field, so the literature is still fairly new.
What is often lost in translation of developing good policies and analysis is the true impact to the people. How does this impact a household with one working parent and two kids?
However, anecdotally one thing economists do know is that the more information an individual has to make a decision the better the outcome. In this case, informing individuals of what income changes do to their annual potential savings, budget, and take home pay is vital in helping them shape the outcomes they want to achieve. Whether it’s buying a home, saving for college, or retirement. This tool could be one way households begin the conversation and build their financial education toolbox.
What’s the Story?
What did we do? We took something known (pay calculators) and built in a new component (benchmark spending) to create this tool. Why is it important? Because the better information individuals have, the better they can plan for the outcomes they want. Think back to your first summer job. Did you know what your paycheck was going to say at the end of two weeks? Did you think it would be just your hourly wage multiplied by your hours? Let’s face it, if you ask me on the street to tell you what is taken out of my check for Social Security, I probably can’t tell you. However, now I can pull out my cellphone and enter a few key components and tell you instantly.
For policy analysts, we can think about what a change in minimum wage may look like to individuals. We could take the current wage and look at the benchmark budget pre- and post-increase and get a sense of the change in the household’s ability to save and spend. The ability to use Tableau and integrate for the web in a format that has a great user interface has been a game changer.
Let’s face it, if you ask me on the street to tell you what is taken out of my check for Social Security, I probably can’t tell you. However, now I can pull out my cellphone and enter a few key components and tell you instantly.
Looking Forward
So to recap, you can do more with a dashboard than simply static data analytics and reporting. You could do something where it becomes an interactive tool for residents to use when considering job changes, saving, and/or life goals. Thinking outside-of-the-box could be a way to take innovation to a new level. More often than not, you don’t have to look far to be innovative, just ask “does what I am doing simplify something, make an impact, and answer the question people often wonder but don’t voice?”